


Contents
Scroll to:
https://doi.org/10.17747/2618-947X-2022-1-26-36
Scroll to:
The development of digital production technologies, taking place within the framework of the global fourth industrial revolution, creates conditions for increasing the level of customization of industrial production, i.e. the ability to manufacture products that reflect the preferences of small groups of consumers and even individual customers. Product customization, as one of the most important aspects of the fourth industrial revolution, is of great interest for researchers and has been becoming one of the promising trajectories for the development of new production technologies and methods of organizing production. But at the same time, the economic effect of increasing the customization of products remains not fully understood. This study is aimed at identifying various economic effects arising from customization in industrial enterprises, and their quantitative assessment in relation to the manufacturing industries of the Russian industry. Using a systematic review of available scientific research and analytical reports, the study quantifies the economic effects of customization in various sectors of the Russian economy. The results show the colossal effect of further customization in Russian enterprises. The authors conclude that the annual effect of revenue growth in all industries, even under the most pessimistic scenarios and estimates, is 1.9 trillion rubles, and the effect of cost reduction – 1.4 trillion rubles. The results obtained can form the basis of government measures to stimulate the customization of products of Russian industrial enterprises.
Titov S.A., Titova N.V. ESTIMATION OF ECONOMIC EFFECTS FROM PRODUCT CUSTOMIZATION OF RUSSIAN INDUSTRIAL ENTERPRISES. Strategic decisions and risk management. 2022;13(1):26-36. https://doi.org/10.17747/2618-947X-2022-1-26-36
The development of digital production technologies in the conditions of the global fourth industrial revolution creates conditions for the increase in the level of product customization, that is, match of its functional, ergonomic and aesthetic characteristics to the tastes and preferences of small groups or even individual consumers [Industry transformation..., 2018]. Additive technologies make it possible to produce according to individual projects without significant restructuring of production lines. 3D modeling offers the opportunity to create complex, highly accurate product models that reflect the preferences of individual customers. Collaborative design platforms create conditions for involving consumers in the development of new products, their rapid testing and prototyping. Cloud information services can unite a large number of participants in the same supply chain within a single space of activity. Digital technologies form flexible manufacturing systems that produce customized products on a mass basis.
The customization of industrial production is of great interest on the part of researchers and is becoming one of the promising trajectories for the development of new production technologies and methods of industrial management [Popadyuk, 2008]. At the same time, the economic effect of increasing product customization remains poorly understood [Piller et al., 2004]. This study is aimed at identifying various economic effects arising from customization in industrial enterprises, and their quantitative assessment in relation to the manufacturing industries in Russia. The first section presents the results of the scientific literature review, based on which the research task is formulated. Next, the research methodology is described, followed by the main results which consist of the economic assessment of various effects from customization in the context of types of production activities, various scales of these effects and scenarios for the development of the Russian economy. In conclusion, the main findings are formulated, the limitations of the study are given, and the directions for further research are determined.
The rapid development of production technologies and methods of industrial management in the direction of increasing its flexibility and responsiveness to consumer needs is accompanied by an increase in the average level of product customization. Product customization can be viewed as the correspondence of engineering, functional, style and other characteristics to the preferences of specific consumers. Customized products and services are meant to meet the needs of relatively small groups or even individual customers [Kudryavtseva, 2016]. Product customization can be understood as a set of processes for its development, production and sale and related included in it services [Piller, Reichwald, 2002].
Customization affects almost all sectors of the economy and spheres of public activity. Customization is subject not only to consumer goods traditionally focused on a specific customer, such as clothing or furniture, but also to products of industrial enterprises. The dynamics of publications in the Scopus database with the term customization in the title, keywords, and abstract grew steadily until 2009 (Fig. 1), after which there was a decline in the number of publications, and then a new, somewhat fluctuating, but stable growth arose until 2021. The second wave of interest in customization can be explained by the fact that new digital technologies, which are currently rapidly transforming the landscape of economic activity, have enormous potential to increase the level of customization of products and services.
Traditionally, the production of customized products was accompanied by the creation of more value for the customer, but at the same time, the increase in product diversity significantly enhanced the value of such products. This led to the fact that effective customization arose only in narrow market niches. However, with the development of modern digital technologies and the new approaches to the organization of production on their basis, customization began to be characterized by decreasing costs, which led to the emergence of the phenomenon of mass customization, that is, the possibility of producing customized products for a large number of customers.
Technologies aimed at the production of customized products usually include:
etc. [Saniuk et al., 2020].
Organizational methods and customization tools often include:
and others [New production technologies, 2015].
The use of digital technologies leads to the emergence of mass customization, when customized products are produced in large volumes and personalization of products and services, when they are created for a specific consumer. Customization began to be characterized by various levels and implementation options (assembly to order, production to order, development to order, etc.), described by different breadth and depth of customization. Narrow customization involves adapting products to the requirements of individual customers. Broad customization usually means adapting products to the requirements of different customer groups. Narrow customization tends to create more value for the customer, but comes at a higher cost. Deep customization affects the project (design) of products, the processes of production or assembly, the processes of product sales. More superficial customization may concern only product packaging. Even more superficial customization occurs within retail sales and customer relationship management. Most researchers hold the opinion that deeper customization has the greatest economic effect [Matulik, 2008].
Given the interest to the development of customization, its economic effect in the context of various economy sectors remains insufficiently considered. In the Scopus database, 59 reviews of publications on the topic of customization were identified, and none of them addressed the economic assessment of the customization effect in the context of economic sectors. Most studies deal with the qualitative effect of customization at the level of individual enterprises or in the context of the development of certain technologies [Piller et al., 2004]. At the same time, the assessment of the economic effect of customization seems to be a rather important scientific task, since the state incentives for strengthening customization through the use of digital technologies are declared in some policy documents, but at the same time, the effectiveness of these incentive efforts does not seem obvious [New production technologies, 2015].
By the fact that the greatest economic effect from customization is expected from deep customization within the framework of industrial production using digital technologies, in this article the research task is as follows: to quantify the economic effect of the development of production technologies and methods of industrial management that provide an increase in the customization of products in the context of the manufacturing industries.
This study is based on the analysis of secondary sources via the review of consulting and analytical companies and scientific articles, aimed at qualitative identifying the economic effects of customization and summarizing the quantitative assessment of these effects. The assessment of the positive effect is summarized in the form of the effects of cost reduction and revenue growth of enterprises. The effects of customization are evaluated taking into account the maturity levels of customization on enterprises in various industries. It is also taken into account that the available data relate to economies that are ahead of the Russian in their digital development. Due to the lack of systematic data on customization costs, the study estimates these costs based on the percentage of failed digital transformation projects of companies. The parameters obtained in the course of summarizing the available data are applied to statistical data on the volume of activity in the context of manufacturing industries. In this case, three levels of effect are formed: maximum, average and minimum, as well as three scenarios for the development of the economy: optimistic, realistic and pessimistic.
In the scientific research and analytical reviews, two groups of economic effects arising from customization at the level of manufacturing enterprises can be identified. Cost reductions include:
The group of revenue growth effects includes the following:
Considering the industry as a set of enterprises producing similar products, we can conclude that the identified two groups of effects at the level of enterprises form generalized effects on the scale of industries and industrial production as a whole.
The cost reduction effect of customization was found in [Piller et al., 2004], where it is estimated at 30% for the garment industry. Naturally, customization is not able to realize this potential fully in any company and industry, even within the framework of a super-optimistic scenario. The introduction of the "Customized Product" technological complex is an initiative for the digital transformation of the enterprise. The success of digital transformations is estimated at 24% [Unlocking success.., 2018], 20% [Morakanyane et al., 2020], and even 10% [Ramesh, Delen, 2021] of all initiatives. An intermediate value of 20% gives the maximum achievable cost reduction effect from customization
of 30% × 0.20 (i.e. 20%) = 6% of revenue.
There are noticeably more quantitative estimates of the effect of growth in revenue from customization in open sources, but they are all heterogeneous and also require the formulation of a number of assumptions. Thus, according to a study by BCG, personalization of consumer experience through advanced digital technologies has allowed companies to increase revenue by 5 to 10% per year [Abraham et al., 2019]. It concerned only advanced companies in terms of customization. According to the results of the survey, the authors of the research [Boudet et al., 2019] conclude that personalization leaders have 5–15% more revenue than the industry on average. Deloitte has found that 50% of shoppers are interested in customized products, and that different proportions of shoppers are willing to pay different price premiums for personalized products [Jeffrey et al., 2015]. For example, the share of those willing to pay 50% or more on top of the price is 11% among shoe buyers and 3% among drink buyers.
In this mixed picture, it is assumed that, despite the diversity of customer preferences and industries, the growth in revenue from customization is determined by the ability of companies to realize this effect. To streamline quantitative estimates of the effect of revenue growth, you can use the model of customization maturity levels (in the original – personification) proposed by BCG [Abraham et al., 2019]. Four levels were formed; each of them was characterized by certain content aspects, the share of companies with these aspects identified in the course of the survey and an indicator of revenue growth from customization. The main parameters of the model are presented in Table 1.
The metrics proposed by BCG should be adjusted for the percentage of digital transformation initiatives that fail, and thereby, the cost of customization initiatives should be taken into account at least in this crude form. Average revenue growth per year is also multiplied by 0.20, as it was done for cost reduction. Adjusted figures are given in
Table. 2 (line B).
It should be noted that the BCG model was built primarily for retail and therefore has the ability to transfer to companies involved in the production of food, beverages and tobacco products. As sources of additional data, the work of [Matulik, 2008] was used which also provides a grouping of companies by customization levels but in the context of individual industries. The number of levels in the model from [Matulik, 2008] is the same as the BCG model, but the grouping methodology is different. This model is based on the volume (or in terms of the author, intensity) of customization in the industry at various levels rather than on the number of companies. Despite methodological differences, the data from the two models are combined.
More complete parameters for the distribution of companies by customization levels are shown in Table. 2. Due to the fact that companies at the leading level were not identified in both models, the corresponding column was excluded.
Returning to the effect of cost reduction, it should be assumed that the maximum effect (6% of revenue, see 3.2 of this article) can only be assumed at the highest level of customization, in terms of the BCG model – the leading one. Based on this, the achievement of the cost reduction effect is differentiated by customization levels in the same proportion as the revenue growth indicator in the BCG model which is shown in line 3 of Table. 2.
To determine the industry-wide effects from customization in terms of revenue growth and cost reduction, it is necessary to find their average value, weighted by the volume of activities at different levels of customization. In other words, the sum of pairwise products of the effect by levels and the share of activity by levels is found. So, for example, the average effect of revenue growth in the clothing industry will be found
as 0 × 0.43 + 2 × 0.36 + 5 × 0.21 = 1.77% (highlighted in Table 2 by light shading). The average cost reduction effect in the vehicle manufacturing industry will be calculated as 0 × 0.49 + 1.50 × 0.26 + 3.75 × 0.25 = 1.33% (highlighted in Table 2 by dark shading).
All calculated indicators are given in Table 2 in the "Industry Effect" columns.
Fig. 1. Annual dynamics of publications on the topic
of customization in scientific areas of management and business
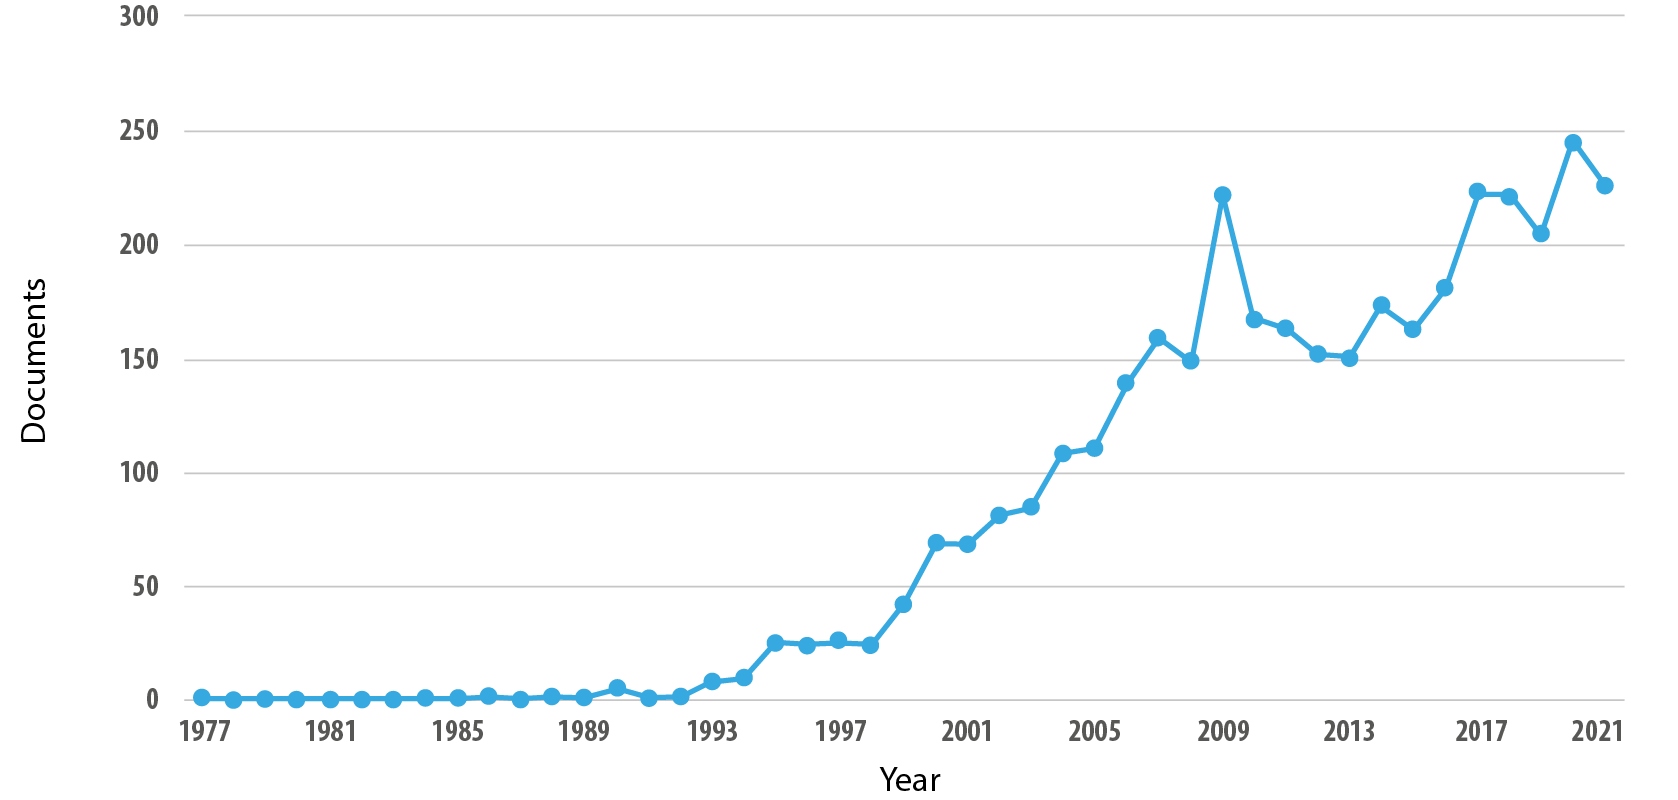
Table 1
Key parameters of the BCG customization (personalization)
maturity level model (%)
|
Indicator |
Customization level |
|||
|
lagging |
basic |
innovative |
leading |
|
|
Average revenue growth per year |
0 |
10 |
25 |
40 |
|
Share of companies |
41 |
40 |
19 |
0 |
Table 2
Indicators of industry effects from customization (%)
|
№ |
Indicator |
Customization maturity level |
Industry-based effect |
|||
|
lagging |
basic |
innovative |
Revenue growth |
Cost reduction |
||
|
Customization effects |
||||||
|
В |
Average revenue growth per year |
0 |
2 |
5 |
— |
— |
|
Z |
Cost reduction per year |
0 |
1.50 |
3.75 |
— |
— |
|
Amount of activity |
||||||
|
1 |
Manufacture of food products, drinks, tobacco products |
41 |
40 |
19 |
1.75 |
1.31 |
|
2 |
Manufacture of clothes |
43 |
36 |
21 |
1.77 |
1.33 |
|
3 |
Vehicle manufacturing industry |
49 |
26 |
25 |
1.77 |
1.33 |
|
4 |
Printing |
32 |
35 |
33 |
2.35 |
1.76 |
|
5 |
Manufacture of computers, electronic and optical products |
61 |
7 |
32 |
1.74 |
1.31 |
|
6 |
Furniture production |
52 |
27 |
21 |
1.59 |
1.19 |
|
7 |
Manufacture of paper and paper products |
35 |
0 |
65 |
3.25 |
2.44 |
It should be noted that [Matulik, 2008; Abraham et al., 2019] were based on the consideration of fairly advanced economies. It is problematic to transfer them without adjustment to the Russian economy. At the same time, there are no mechanisms for adapting the obtained values to Russian realities in the scientific and analytical literature. To solve this problem, it is proposed to assume that since customization largely involves digital transformation, the effect of it to a certain extent will depend on the level of the economy digitalization. If you look at the digital development indices of the Russian Federation in comparison to other countries1, it turns out that the best results for Russia are characterized by ranking at the end of the second ten best countries (for example, according to the E-Government Development Index – 36th place out of 193, according to the Inclusive Internet Index – 25th out of 120). The worst ones are on the verge of the last third of countries (for example, according to the World Digital Competitiveness Ranking – 43rd out of 63 countries). In most cases, Russia is closer to the lower border of the first third of the countries.
The research [Matulik, 2008; Abraham et al., 2019] covered companies from various countries, which were most often within the top ten countries in many rankings. From this we can assume that Russia differs from the considered countries by an average of 25 points out of an average rating scale of 100 points. Thus, taking into account indicators calculated in Table 2, it makes sense to reduce them by 25%. The obtained indicators are given in Table 3.
Further, it should be assumed that the size of the found effects will change over time as companies move between different levels of customization because the market will favor more and more customized products and companies will invest more in customization. Unfortunately, there is not much temporal analytics in open sources, which allows to build dynamic scenarios, and it is very fragmented.
Thus, the study [Abraham et al., 2019] found that the best companies allocate investments for customization in the amount of 0.9% of turnover, while on average all the studied companies invest 0.7%. Going forward, top companies are expected to spend 30% of their turnover on customization, with an average customization investment of 18%. Unfortunately, the fact about predicting this future is not specified in [Abraham et al., 2019].
[Wilson, 2007] found that most executives expected (as of 2007) an increase in demand for customized products at the level of 25 to 50% per year. A study [Kanama, 2018] finds less impressive growth. The author studied the growth of the customized drinks segment in Japan and concluded that sales volumes in these segments in the period 2010–2015 increased steadily by 1.2% per year. The share of this segment in the indicated period also grew and at a faster pace – 2.1% per year. This happened at the time when the beverage industry as a whole was shrinking.
You can also pay attention to secondary trends that reflect the interest of companies in the development of customization. For example, the work of [Mourtzis, Doukas, 2014) analyzes the number of articles in the Scopus database with the terms “mass customization” and “personalization” as keywords. The dynamics of the number of articles reproduces the classic hype cycle with a characteristic peak in 2003 and a return to the main trend already in 2004. The average increase in publications in the period 2000–2012 was 12.2% per year.
As another proxy trend we can consider the one in the field of 3D printing which, of course, does not exhaust the whole variety of technological solutions for customization, but in most cases they act as the main one. [Roberts, 2021] summarizes 11 forecasts for the period 2020–2026 and concludes that 3D printing market growth of 11.7% per year can be considered as a consensus forecast. In [Crozet V., 2018] the development of additive technologies for the automotive industry in the period 2020–2028 is estimated at 16.4% growth per year.
We can discard the 25–50% and 2.1% growth rates as extreme and consider the 12–18% customization growth corridor as the main one with 15% as the average and use these indicators for the period 2022–2028. With regard to the growth indicator there is a decrease of 25% due to the fact, that the range of 12–18% is identified on the basis of advanced economies, from which Russia is noticeably behind in digital development ratings. Thus, to assess the growth of effects from customization, it is proposed to use the range of 9–13.5%, with an average value of 11.25% effect growth per year.
For the basic scenario,2 we will consider statistics on the volume of shipped goods by the type of economic activity in the context of manufacturing industries for 2021. For each industry, we determine separately the effect of revenue growth and the effect of cost reduction according to Table. 3 (Columns "Industry effect") for 2021, and then calculate the indicators for the period 2022–2027 based on the forecast of 11.25% annual growth in effects. The calculations are presented in Table 4.
Unfortunately, it was not possible to determine the effects of customization for all industries of industrial production, and perhaps these effects do not make sense to expect for all industries. In the course of the study, not a single case of customization was found in such industries as the production of coke and petroleum products, metallurgical production, the production of chemicals and chemical products and the production of other non-metallic mineral products. These industries were excluded from the calculations. For industries where the cases were found in the literature, but the effects in Table. 3 were not calculated, a decision was made to apply the effect size out of those defined in Table. 3 based on the expert judgment of the authors of this study. The decision was made based on the similarity of customization potentials arising from the specifics of the product (how differentiable it is) and demand (how sensitive consumers are to creating additional value through customization). In Table. 4, column "Tab2", the line of Table 3 is indicated, from which the indicators of the customization effect were taken.
Under the baseline scenario, the effect of customization due to revenue growth over 6 years for all manufacturing industries amounted to 3.3 trillion rubles, and due to cost reduction – 2.5 trillion rubles. Note that these effects only take into account the costs associated on average with failed customization initiatives.
As industries with the greatest absolute effect, the production of food products, paper and paper products, finished metal products, motor vehicles and other vehicles should be noted. The industries with the greatest relative effect include the production of paper and products from it, printing activities.
The basic scenario calculated in Table 3 builds upon the fact that the volume of activity in 2021 can be considered as an average for the next 6 years. However, this scenario in the current geo-economic conditions seems to be optimistic. Therefore, in general, for the branches of industrial enterprises, it is advisable to consider other scenarios, also taking into account the different levels of a certain corridor of effect growth from customization (12–18% per year).
As a basis for the second, realistic, scenario, the indicator of activity volumes of 80% from the level in 2021 will be taken into account. As a basis for the third, pessimistic, scenario, an activity volumes of 60% from the level in 2021 will be used. The calculation results are shown in Table 5.
The effect of revenue growth for various combinations of scenarios and growth estimates varies from 1.9 trillion rubles up to 3.5 trillion rubles. The effect of cost reduction varies from 1.4 trillion rubles up to 2.7 trillion rubles.
Table 3
Indicators of sectoral effects from customization for the Russian Federation (%)
|
№ |
Industrial activity |
Industry-based effect |
|
|
Revenue growth |
Cost reduction |
||
|
1 |
Manufacture of food products, drinks, tobacco products |
1.31 |
0.98 |
|
2 |
Manufacture of clothes |
1.33 |
1.00 |
|
3 |
Vehicle manufacturing industry |
1.33 |
1.00 |
|
4 |
Printing |
1.76 |
1.32 |
|
5 |
Manufacture of computers, electronic and optical products |
1.31 |
0.98 |
|
6 |
Furniture production |
1.19 |
0.89 |
|
7 |
Manufacture of paper and paper products |
2.44 |
1.83 |
Tab. 4. Effect of customization by industry of manufacturing companies for 2022–2026 (mln rubles)
|
2021 |
2022 |
2023 |
2024 |
2025 |
2026 |
2027 |
2022–2027 |
||||||||||||
|
Type of activity |
Table 2 |
Size of revenue growth effect (%) |
Size of cost reduction effect (%) |
Scope of activity |
The effect of revenue growth (million rubles) |
Cost reduction effect (million rubles) |
The effect of revenue growth (million rubles) |
Cost reduction effect (million rubles) |
The effect of revenue growth (million rubles) |
Cost reduction effect (million rubles) |
The effect of revenue growth (million rubles) |
Cost reduction effect (million rubles) |
The effect of revenue growth (million rubles) |
Cost reduction effect (million rubles) |
The effect of revenue growth (million rubles) |
Cost reduction effect (million rubles) |
The effect of revenue growth over |
Effect of cost reduction over |
Overall effect over |
|
Food production |
1 |
1.31 |
0.98 |
8 134 791 |
106 566 |
79 721 |
116 157 |
86 896 |
126 611 |
94 717 |
138 006 |
103 242 |
150 427 |
112 534 |
163 965 |
122 662 |
801 732 |
599 772 |
1 401 504 |
|
Beverage production |
1 |
1.31 |
0.98 |
950 689 |
12 454 |
9 317 |
13 575 |
10 156 |
14 797 |
11 070 |
16 129 |
12 066 |
17 581 |
13 152 |
19 163 |
14 336 |
93 699 |
70 097 |
163 796 |
|
Tobacco production |
1 |
1.31 |
0.98 |
263 744 |
3 455 |
2 585 |
3 766 |
2 818 |
4 105 |
3 072 |
4 474 |
3 348 |
4 877 |
3 649 |
5 316 |
3 977 |
25 993 |
19 449 |
45 442 |
|
Textile production |
2 |
1.33 |
1.00 |
332 834 |
4 427 |
3 328 |
4 825 |
3 628 |
5 259 |
3 955 |
5 732 |
4 311 |
6 248 |
4 699 |
6 810 |
5 122 |
33 301 |
25 043 |
58 344 |
|
Clothes manufacture |
2 |
1.33 |
1.00 |
212 816 |
2 830 |
2 128 |
3 085 |
2 320 |
3 363 |
2 529 |
3 666 |
2 757 |
3 996 |
3 005 |
4 356 |
3 275 |
21 296 |
16 014 |
37 310 |
|
Manufacture of leather and leather goods |
2 |
1.33 |
1.00 |
83 291 |
1 108 |
833 |
1 208 |
908 |
1 317 |
990 |
1 436 |
1 079 |
1 565 |
1 176 |
1 706 |
1 282 |
8 340 |
6 268 |
14 608 |
|
Wood processing and product manufacturing |
6 |
1.19 |
0.89 |
1 070 775 |
12 742 |
9 530 |
13 889 |
10 388 |
15 139 |
11 323 |
16 502 |
12 342 |
17 987 |
13 453 |
19 606 |
14 664 |
95 865 |
71 700 |
167 565 |
|
Manufacture of paper and paper products |
7 |
2.44 |
1.83 |
1 291 817 |
31 520 |
23 640 |
34 357 |
25 768 |
37 449 |
28 087 |
40 819 |
30 615 |
44 493 |
33 370 |
48 497 |
36 373 |
237 135 |
177 853 |
414 988 |
|
Printing |
4 |
1.76 |
1.32 |
314 994 |
5 544 |
4 158 |
6 043 |
4 532 |
6 587 |
4 940 |
7 180 |
5 385 |
7 826 |
5 870 |
8 530 |
6 398 |
41 710 |
31 283 |
72 993 |
|
Production of coke and oil products |
– |
0 |
0.00 |
11 944 585 |
– |
– |
– |
– |
– |
– |
– |
– |
– |
– |
– |
– |
– |
– |
– |
|
Production of chemical substances |
– |
0 |
0.00 |
5 112 962 |
– |
– |
– |
– |
– |
– |
– |
– |
– |
– |
– |
– |
– |
– |
– |
|
Production of medicines |
3 |
1.33 |
1.00 |
1 375 658 |
18 296 |
13 757 |
19 943 |
14 995 |
21 738 |
16 345 |
23 694 |
17 816 |
25 826 |
19 419 |
28 150 |
21 167 |
137 647 |
103 499 |
241 146 |
|
Manufacture of rubber and plastic products |
3 |
1.33 |
1.00 |
1 721 425 |
22 895 |
17 214 |
24 956 |
18 763 |
27 202 |
20 452 |
29 650 |
22 293 |
32 319 |
24 299 |
35 228 |
26 486 |
172 250 |
129 507 |
301 757 |
|
Manufacture of other non-metallic mineral products |
– |
0 |
0.00 |
2 071 496 |
– |
– |
– |
– |
– |
– |
– |
– |
– |
– |
– |
– |
– |
– |
– |
|
Metallurgical production |
– |
0 |
0.00 |
10 438 092 |
– |
– |
– |
– |
– |
– |
– |
– |
– |
– |
– |
– |
– |
– |
– |
|
Manufacture of finished metal products |
3 |
1.33 |
1.00 |
3 163 606 |
42 076 |
31 636 |
45 863 |
34 483 |
49 991 |
37 586 |
54 490 |
40 969 |
59 394 |
44 656 |
64 739 |
48 675 |
316 553 |
238 005 |
554 558 |
|
Manufacture of computers, electronic and optical products |
5 |
1.31 |
0.98 |
1 625 925 |
21 300 |
15 934 |
23 217 |
17 368 |
25 307 |
18 931 |
27 585 |
20 635 |
30 068 |
22 492 |
32 774 |
24 516 |
160 251 |
119 876 |
280 127 |
|
Production of electrical equipment |
5 |
1.31 |
0.98 |
1 259 660 |
16 502 |
12 345 |
17 987 |
13 456 |
19 606 |
14 667 |
21 371 |
15 987 |
23 294 |
17 426 |
25 390 |
18 994 |
124 150 |
92 875 |
217 025 |
|
Manufacture of machinery and equipment |
3 |
1.33 |
1.00 |
1 590 216 |
21 150 |
15 902 |
23 054 |
17 333 |
25 129 |
18 893 |
27 391 |
20 593 |
29 856 |
22 446 |
32 543 |
24 466 |
159 123 |
119 633 |
278 756 |
|
Vehicle manufacturing |
3 |
1.33 |
1.00 |
3 194 663 |
42 489 |
31 947 |
46 313 |
34 822 |
50 481 |
37 956 |
55 024 |
41 372 |
59 976 |
45 095 |
65 374 |
49 154 |
319 657 |
240 346 |
560 003 |
|
Manufacture of other vehicles |
3 |
1.33 |
1.00 |
2 246 438 |
29 878 |
22 464 |
32 567 |
24 486 |
35 498 |
26 690 |
38 693 |
29 092 |
42 175 |
31 710 |
45 971 |
34 564 |
224 782 |
169 006 |
393 788 |
|
Furniture manufacture |
6 |
1.19 |
0.89 |
373 284 |
4 442 |
3 322 |
4 842 |
3 621 |
5 278 |
3 947 |
5 753 |
4 302 |
6 271 |
4 689 |
6 835 |
5 111 |
33 421 |
24 992 |
58 413 |
|
Manufacture of other finished products |
3 |
1.33 |
1.00 |
315 937 |
4 202 |
3 159 |
4 580 |
3 443 |
4 992 |
3 753 |
5 441 |
4 091 |
5 931 |
4 459 |
6 465 |
4 860 |
31 611 |
23 765 |
55 376 |
|
Repair and installation of machinery and equipment |
3 |
1.33 |
1.00 |
1 245 481 |
16 565 |
12 455 |
18 056 |
13 576 |
19 681 |
14 798 |
21 452 |
16 130 |
23 383 |
17 582 |
25 487 |
19 164 |
124 624 |
93 705 |
218 329 |
|
Total for manufacturing industries |
60 335 179 |
420 441 |
315 375 |
458 283 |
343 760 |
499 530 |
374 701 |
544 488 |
408 425 |
593 493 |
445 181 |
646 905 |
485 246 |
3 163 140 |
2 372 688 |
5 535 828 |
|||
Tab. 5. Effect of customization by manufacturing industries across three scenarios (mln rubles)
|
Economic development scenario |
Total production activity |
9% increase in effects |
11.25% increase in effects |
13.5% increase in effects |
||||||
|
The effect from revenue growth |
Cost reduction effect |
Mass effect |
The effect from revenue growth |
Cost reduction effect |
Mass effect |
The effect from revenue growth |
Cost reduction effect |
Mass effect |
||
|
Optimistic |
60 335 179 |
3 163 140 |
2 372 688 |
5 535 828 |
3 347 958 |
2 511 319 |
5 859 277 |
3 543 662 |
2 658 110 |
6 201 772 |
|
Realistic |
48 268 143 |
2 530 496 |
1 898 136 |
4 428 632 |
2 678 371 |
2 009 055 |
4 687 426 |
2 834 942 |
2 126 500 |
4 961 442 |
|
Pessimistic |
36 201 107 |
1 897 867 |
1 423 621 |
3 321 488 |
2 008 782 |
1 506 802 |
3 515 584 |
2 126 183 |
1 594 901 |
3 721 084 |
Thus, an increase in the level of product customization in the Russian industry is characterized by a group of effects leading to a reduction in the costs of industrial enterprises (optimization of product architecture, economies of scale and diversity, an increase in the efficiency of innovation, reduction in the cost of switching between suppliers, etc.) and growth revenue (increased willingness to pay, satisfaction, customer lifetime value, etc.). Despite the lack of systematic data to assess the identified groups of effects from customization for the Russian economy, based on the available fragmentary information and the assumptions adopted in the study, quantitative indicators of the effects for the Russian manufacturing industries were calculated. The assessment of the customization effects is built in relation to the volume of production activity in the manufacturing industries of the Russian economy. An optimistic scenario considers the volume of production for 2021, realistic – 80% of this volume and pessimistic – 60%. Within each of the scenarios, the effect is estimated in the context of a corridor from 9 to 13.5% with an average value of 11.25%.
The effect of revenue growth, even at the lowest value, is estimated at 1.9 trillion rubles, and the effect of cost reduction is 1.4 trillion rubles. The figures obtained, even taking into account fairly aggregated estimates of the costs of customization and the probabilistic nature of many assumptions, indicate a huge economic effect from the introduction of digital customization technologies at Russian industrial enterprises. The presented calculations do not take into account other socio-economic effects, the assessment of which is even more difficult: an increase in the quality of life due to growing perceived quality of products as a result of its customization. Among them is job creation with advanced digital and out of the box skills and stimulation of entrepreneurial activity in the field of implementing customized technologies and analytics, improvement of Russian industrial companies’ positions in foreign markets. These aspects can be attributed to the most significant limitations of the present study.
However, for the full realization of the effects estimated above, active actions of producers and a change in consumer behavior are required. Identification of mechanisms for changing the behavior of producers and consumers and the formation of proposals to stimulate the development of these mechanisms seem to be a promising direction for further research in the field of product customization at industrial enterprises.
1 Digital Economy: 2022. Brief Statistical Collection. Moscow: НИУ ВШЭ. ISBN 978–5-7598-2599–9. DOI: 10.17323/978–5-7598-2599–9.
2 Rosstat. Industrial production (2022). https://rosstat.gov.ru/enterprise_industrial.
1. Kudryavtseva I.G. (2016). The era of mass customization in the modern economy. Russian Technological Journal, 4(1): 62-70. (In Russ.)
2. New production technologies (2015). Public Analytical Report. Moscow, Delo. ISBN 978-5-7749-1064-9. (In Russ.)
3. Popadyuk T.G. (2008). State innovation policy of Russia as an imperative to ensure the country's competitiveness in the context of globalization. Innovations, 10(120): 112-116. (In Russ.)
4. Trachuk A.V. (ed.). (2018). Transformation of industry in the conditions of the fourth industrial revolution. Moscow, Real’naya ekonomika. ISBN 978-5-9216-2287-6. (In Russ.)
5. Abraham M., Van Kerckhove J.-F., Archacki R., González J.E., Fanfarillo S. (2019). The next level of personalization in retail. Boston Consulting Group. https://web-assets.bcg.com/img-src/BCG-The-Next-Level-of-Personalization-in-Retail-June-2019-R_tcm9-221168.pdf.
6. Boudet J., Gregg B., Rathje K., Stein E., Vollhardt K. (2019). The future of personalization - and how to get ready for it. McKinsey & Company. https://www.mckinsey.com/business-functions/marketing-and-sales/our-insights/the-future-of-personalization-and-how-to-get-ready-for-it.
7. Crozet V. (2018). Smartech issues new report on automotive additive manufacturing market, sees $5.3 billion market in 2023. SmarTech Analysis. https://www.smartechanalysis.com/news/smartec-report-automotive-additive-manufacturing-market/.
8. Dessler W. (2021). 5 benefits of mass customization to make your company more competitive. Workest. https://www.zenefits.com/workest/5-benefits-of-mass-customization-to-make-your-company-more-competitive/.
9. Guneshka D. (2021). Benefits of product personalization. Iplabs.de. https://www.iplabs.de/en/blog/blog/benefits-of-product-personalization.
10. Hinz P. (2013). Effects of mass customisation on manufacturing. Adaptalift. https://www.adaptalift.com.au/blog/2013-06-17-effects-of-mass-customisation-on-manufacturing.
11. Jeffrey C., Vernon-Harcourt O., Lewis H. (2015). The Deloitte consumer review made-to-order: The rise of mass personalisation contents. Deloitte.com. https://www2.deloitte.com/content/dam/Deloitte/ch/Documents/consumer-business/ch-en-consumer-business-made-to-order-consumer-review.pdf.
12. Kanama D. (2018). Manufacturing transformation toward mass customization and personalization in the traditional food industry. In: Petrillo A., Cioffi R., De Felice F. (eds.). Digital transformation in smart manufacturing. London, InTech. https://www.intechopen.com/chapters/58030.
13. Mass сustomization: 4 benefits that can make your company more competitive (2020). alcimed. https://www.alcimed.com/en/alcim-articles/mass-customization-4-benefits-that-can-make-your-company-more-competitive/.
14. Matulik P. (2008). Mass customization. Tomas Bata Univserity. http://195.178.95.140:8080/bitstream/handle/10563/6523/matul%C3%ADk_2008_dp.pdf?sequence=1&isAllowed=y.
15. Morakanyane R., O’Reilly P., Mcavoy J. (2020). Determining digital transformation success factors. In: Proceedings of the Annual Hawaii International Conference on System Sciences. USA, 4356–4365.
16. Mourtzis D., Doukas M. (2014). Design and planning of manufacturing networks for mass customisation and personalisation: Challenges and outlook. Procedia CIRP, 19: 1–13. DOI: 10.1016/j.procir.2014.05.004.
17. Piller F., Reichwald R. (2002). Mass customization. Strategic production networks. Berlin, Heidelberg, Springer Berlin Heidelberg, 389-421.
18. Piller F.T., Moeslein K., Stotko C.M. (2004). Does mass customization pay? An economic approach to evaluate customer integration. Production Planning & Control, 15(4): 435-444. DOI: 10.1080/0953728042000238773.
19. Riemer K., Totz C. (2003). The many faces of personalization. In: Tseng M.T., Piller F.T. (еds.). The Customer centric enterprise: 35-50. Berlin, Heidelberg, Springer Berlin Heidelberg.
20. Ramesh N., Delen D. (2021). Digital transformation: How to beat the 90% failure rate? IEEE engineering management review, 49(3): 22-25. DOI: 10.1109/emr.2021.3070139.
21. Roberts T. (2021). 3D printing trend report. Hubs. https://www.hubs.com/get/trends/.
22. Saniuk S., Grabowska S., Gajdzik B. (2020). Personalization of products in the Industry 4.0 concept and its impact on achieving a higher level of sustainable consumption. Energies, 13(22): 5895. DOI: 10.3390/en13225895.
23. Unlocking success in digital transformations (2018). McKinsey & Company. https://www.mckinsey.com/business-functions/people-and-organizational-performance/our-insights/unlocking-success-in-digital-transformations.
24. Wilson J. (2007). Best practices mass customization and build-to-order manufacturing. Cincom, Cincinnati.
Candidate of Economic Sciences, MBA, Associate Professor, Higher School of Management of Financial University under the Government of the Russian Federation (Moscow, Russia). ORCID: 0000-0001-6857-579X, SPIN-code: 8251-9053, Author ID: 451272. Research interest: project management, entrepreneurship, innovation management.
Candidate of Economic Sciences, Senior Lecturer, Department of Project Management, State University of Management (Moscow, Russia). ORCID: 0000-0001-9676-7203, SPIN-code: 6873-7681, Author ID: 640334. Research interest: project management, team management, innovation management.
Titov S.A., Titova N.V. ESTIMATION OF ECONOMIC EFFECTS FROM PRODUCT CUSTOMIZATION OF RUSSIAN INDUSTRIAL ENTERPRISES. Strategic decisions and risk management. 2022;13(1):26-36. https://doi.org/10.17747/2618-947X-2022-1-26-36
Ligovsky av 73, of.401, Saint Petersburg, 190040, Russia
Tel.: +7 (812) 346-50-15 (16)
Real Economy Publishing House.
E-mail: info@jsdrm.ru
Registration certificate PI No. FS-77 - 72389 from 02.28.2018, issued by the Federal Service for Supervision in the Sphere of Communications, Information Technologies and Mass Communications.
Processing of personal data


