


Contents
Scroll to:
https://doi.org/10.17747/2078-8886-2018-4-72-91
Scroll to:
Manvelidze A.B. OPERATING EXPENSES FOR LARGE AMERICAN AIR CARRIERS. Strategic decisions and risk management. 2018;(4):72-91. https://doi.org/10.17747/2078-8886-2018-4-72-91
The main criterion of efficiency in air transport is the cost of air transportation. Indicators of the cost of flights, the volumes of flight or air transport works, flight hours, units of air transport works are applied.
The cost of flights is calculated taking into account the planned or actual costs for wages, maintenance and ownership of aircraft per flight hour and the costs of jet fuel and paid aeronautical and airport services. The costs per unit of work (flight hour, seat-kilometer, passenger-kilometer and ton-kilometer) are used to compare different or similar types of aircraft. They also serve as a cost benchmark in the formation of requirements for the basic performance characteristics of aircraft. The costs price is used in the justification of tariffs for air transportation, in the development of business plans of airlines, in estimating the cost of airplanes in accordance with the profits approach.
The cost of transportation is calculated as a quotient from dividing the sum of expenses specified in the regulatory documents by the volume of performed works (transportation): seat-kilometers (seat-miles), passenger- kilometers (passenger-miles), flight hours, ton-kilometers (ton-miles), maximum ton- kilometers (ton-miles) for the aircraft fleet as a whole for aviation companies or for certain types of aircraft. The cost of transportation is a cost estimate of aviation fuel, materials, energy, fixed assets, labor resources, the cost of overflights and the provision of take-off and landing services for aircraft, passengers and cargo. The cost is significantly affected by the flight performance of the aircraft, in particular, commercial payloads varying according to the range of non-stop flights, flight speed, fuel consumption, route characteristics and flight modes.
The cost of transportation is significantly influenced by cost indicators:
Cost parameters vary in time, due to fluctuations in oil prices and technical improvement of aircraft and aircraft engines.
The regional differences in transportation costs are explained by:
The world civil aviation has adopted a direct accurate accounting of fuel consumption by aircraft types (in tons or gallons). In addition, the number of flights, flight hours and the volume of traffic are calculated according to the types of aircraft. In the Russian Federation such accounting is reflected in statistical forms 32GA and 33GA, which correspond to the forms of the International Civil Aviation Organization (ICAO). The accounting makes it possible to determine the specific fuel consumption by type of aircraft per flight hour, seat-kilometer or kilometer with reference to the average range of non-stop flight.
In order to substantiate the advantages of new modifications one uses an indicator of reduction of specific fuel consumption compared to the existing types of aircraft, an increase in productivity (commercial payload and speed) and flight range.
The International Civil Aviation Organization (ICAO) collects, analyzes and publishes data on the cost of seat-kilometers and passenger-kilometers of airlines. By comparing the cost of a seat- kilometer with revenue rates one can draw conclusions about the profits or losses of airlines.
This article analyzes the cost of transportation of American Airlines Inc., Delta AirLines Inc. and United AirLines Inc. The indices of the cost of transportation and profitability in the period of considerable reduction in prices of jet fuel in 2014-2016 are compared. The focus is on analyzing the fleet renewal and changes (increases) in the main items of expenditures.
One distinguishes between the planned and actual costs. The planned costs are determined by the specified type of aircraft based on the route length, estimated flight time and consumption of jet fuel. Cost parameters are the published prices of fuel, air navigation services, airports, maintenance costs per flight hour and estimated costs of aircraft ownership.
The actual cost is determined according to the initial data of flight time records, the cost of jet fuel, transported passengers, cargo and mail, as well as the data of accounting documents. Determining the actual cost by type of aircraft is a difficult task, because the results of calculations are not always reliable. More correct results can be obtained if at least 50% of the costs are directly recorded according to the types of aircraft.
The collection of the mentioned statistics by types of aircraft is implemented by the US airlines. The reports on flight hours, fuel consumption and direct flight costs are quarterly published by the United States Transportation Statistics Bureau (transtats. bts.gov) in the Airline Finance (AirCarrierFinancial) section of regular (Schedule) for large carriers and annually for other carriers (AirCarrierFinancial: ScheduleP-5.2, P-5.1) [Bureau of Transportation Statistics, [s.a.]].
Indirect costs include the costs of passenger services, airport services (primarily for the take-off and landing of aircraft), air navigation support, transportation sales, advertising, insurance, rental and maintenance of ground infrastructure and other costs. The costs of American carriers for the listed items are recorded for the airline as a whole in Air Carrier Financial: Schedule P-7. For the purpose of the study indirect costs by type of aircraft are distributed in proportion to the flights or aircraft-kilometers (aircraft-miles) taking into account the coefficients reflecting the take-off weight of airplanes.
Cost accounting is also conducted in a group according to economic elements (without separating by type of airline operations) with distinguishing the following items: wages with charges, materials (including jet fuel), services, rent, depreciation and amortization, etc. Airlines data are reflected in the AirCarrierFinancial report: Schedule P-6. The accounting data on cost elements are required when comparing the performance of different types of transport.
The US airlines can be classified into three categories: the leading airline, major airlines and regional airlines. The leading airlines such as American Airlines, DeltaAirLines and UnitedAirlines are large passenger carriers with hubs and a network used by regional airlines operating aircraft with smaller capacity. Major airlines such as Southwest Airlines, Spirit and JetBlue operate from hubs and do not attract regional airlines for flights on their route networks.
It took a long time for the relations between regional carriers and their larger American partners to be formed. The existing organization of the regional airlines’ business is based on regular flights on airplanes with a capacity less than 90 seats from small destinations and secondary hub airports in accordance with contracts for the provision of capacities of regional carriers to large network carriers: American Airlines - American Eagle brand; Delta Airlines - Delta Connection brand and United Airlines - United Express brand.
The existing contractual agreements impose restrictions on the capacity of regional aircraft, the number of regional aircraft that can be used depending on their ratio to the operated main aircraft, limit the range of routes for aircraft of regional airlines and limit the number of regional flights from hub to hub and hours of regional airlines. Restrictions are defined in collective agreements developed by the unions of flight personnel, and are aimed at protecting the interests of pilots of the main airlines. The main reason for the restrictions is the lack of pilots.
Under the current long-term fixed-payment agreements the major airlines pay a fixed rate to regional airlines for operating the aircraft based on the number of flights, the hours flown and the number of aircraft under the contract. In addition, regional airlines performing regional flights on their route networks are reimbursed for fuel, owning or leasing of airplanes, airport and other ground maintenance costs, transportation sales, etc.
The peculiarities of business organization are reflected in the cost structure: united in groups large companies include the items of costs for regional companies into their costs.
American Airlines Group Inc.
The history of American Airlines Group Inc. began with the formation of AMR Corporation in 1982. On December 9, 2013 a subsidiary of AMR Corporation merged with the US Airways Group Inc. After the merger the new company was named American Airlines Group Inc. The integration was completed in April 2015, when the Federal Aviation Administration gave a single operational certificate for both carriers. Today, this big network operator provides regular air transportation of passengers and cargo.
The subsidiaries of American Airlines Group Inc. are AmericanAirlines Inc. operating on the main routes, and regional companies Envoy Aviation Group Inc., PSA Airlines Inc. and Piedmont Airlines Inc.
The American Eagle brand currently uses 10 airlines, including subsidiaries: Envoy, Piedmont and PSA.
Together with regional airlines American Airlines operate about 6700 flights daily (mainly from Charlotte, Chicago, Dallas/ Fort Worth, Los Angeles, Miami, New York, Philadelphia, Phoenix and Washington) to 350 destinations in 50 countries. In 2017 American Airlines Group Inc. transported about 200 million passengers.
American Airlines Group Inc. is one of the founders of the Alliance Oneworld World, whose members coordinate passenger transfers, fares and services. The availability and the use of the fleet of aircraft, transportation volumes, revenues and expenses of the main and regional companies are accounted for separately.
As of December 31 2017 American Airlines operated 948 long-haul aircraft (Table I). In 2017, the group continued the extensive fleet renewal program launched in 2015. During 2017 American Airlines introduced 57 new long-haul aircraft and decommissioned 39 long-haul aircraft.
Table 1
Thefleetof long-haul aircraft of AmericanAirlines, Inc. as of December 31, 2017
Type of aircraft | Average number of seats | Average age (years) | Ownership | Rent | Total |
|---|---|---|---|---|---|
A319 | 128 | 13,8 | 21 | 104 | 125 |
A320 | 150 | 16,7 | 10 | 38 | 48 |
A321 | 178 | 5,4 | 165 | 54 | 219 |
A330-200 | 251 | 6,0 | 15 | — | 15 |
A330-300 | 291 | 17,4 | 4 | 5 | 9 |
737-800 | 160 | 8,1 | 132 | 172 | 304 |
737-8 MAX | 172 | 0,1 | 4 | — | 4 |
757-200 | 180 | 18,1 | 31 | 3 | 34 |
767-300ER | 209 | 19,1 | 24 | — | 24 |
777-200ER | 269 | 17,0 | 44 | 3 | 47 |
777-300ER | 310 | 3,8 | 18 | 2 | 20 |
787-8 | 226 | 2,1 | 20 | — | 20 |
787-9 | 285 | 0,7 | 14 | — | 14 |
Embraer 190 | 99 | 10,2 | 20 | — | 20 |
MD-80 | 140 | 21,3 | 13 | 32 | 45 |
Total | — | 10,1 | 535 | 413 | 948 |
The group supported the renewal of the fleet of its own and third-party regional carriers, which operated flights under the agreements on the purchase and sale of the carriage capacities. As a result of the fleet update the American Airlines Group Inc. had the smallest age of aircraft compared with other major US network operators.
In 2017, under the American Eagle brand a total of 597 regional aircraft performed the flights (Table 2).
During 2017 63 aircraft joined the regional fleet while 72 aircraft were decommissioned.
Obligations regarding the acquisition of long- haul and regional aircraft are shown in Tables 3, 4.
In addition, the group has agreements for 37 spare engines, which will be supplied from 2018. The share of the company’s own aircraft was 56%. The planned long-term costs (liabilities) for the purchase and rental of aircraft, as well as the purchase of carriage capacities of regional companies, are shown in Table 4.
In 2017 the costs of wages and benefits amounted to about 35% of total operating expenditures. As of December 31, 2017 about 126600 active full-time employees worked in the company, approximately 85% of them were members of various trade unions. The distribution of the key personnel by trade unions and professions is given in Table 5.
Financial results are largely influenced by jet fuel prices. The data on fuel consumption and fuel prices for American Airlines Group Inc. are given in Table. 6. The reduction in aviation fuel costs in 2016 was caused by the decrease in the average price per gallon of fuel by 17,4% or by 1,41 dollar per gallon compared to 2015. In 2017 the price of aviation fuel increased by 21,8%. Compared with 2016 the share of jet fuel costs increased by 2 points.
The increase in the average price of a gallon of fuel was partially offset by a 0,7% reduction in specific fuel consumption, which was caused by the introduction of more fuel-efficient aircraft during 2017.
Revenues, expenses, results and other financial and economic indicators of the American Airlines Group Inc. for 2014-2017 are given in Tables 7-8.
American Airlines Group Inc. remained profitable in 2017. The revival of the economy contributed to the growth in demand for transportation. Compared to 2016 the profitability of passenger transport increased by 3,2% (see Table 7, 8 and Fig. I), the total revenues from passenger transportation increased by 1,55 billion dollars or by 4,5% mainly due to the increase in profitability. The internal consolidated profitability increased by 3,5%, while international profitability increased by 3,2% mainly due to the improved performance in Latin America.
Table 2
The fleet of subsidiary regional operators and regional operators operating under the American Eagle brand as of December 31, 2017
Type of aircraft | Average number of seats | Ownership | Rent | Property or rental of a third-party carrier | Total | Regional carrier | The number of the operated aircraft |
|---|---|---|---|---|---|---|---|
CRJ 200 | 50 | 12 | 23 | 33 | 68 | PSA | 35 |
|
|
|
|
|
| AirWisconsin (2) SkyWest Total | 23 10 68 |
CRJ 700 | 66 | 54 | 7 | 49 | 110 | PSA | 34 |
|
|
|
|
|
| Envoy SkyWest ExpressJet Total | 27 37 12 110 |
CRJ 900 | 77 | 54 | - | 64 | 118 | PSA | 54 |
|
|
|
|
|
| Mesa Total | 64 118 |
Dash 8-100 | 37 | 3 | - | - | 3 | Piedmont | 3 |
Dash 8-300 | 48 |
| 11 |
| 11 | Piedmont | 11 |
E175 | 76 | 64 | - | 84 | 148 | Envoy | 44 |
|
|
|
|
|
| Republic Compass Total | 84 20 148 |
ERJ 140 | 44 | 21 | - | - | 21 | Envoy | 21 |
ERJ 145 | 50 | 118 | - | - | 118 | Envoy | 68 |
|
|
|
|
|
| Piedmont Trans States Total | 35 15 118 |
Total |
| 326 | 41 | 230 | 597 |
| 597 |
Table 3
OrdersforpIanesofAmericanAirIines, Inc. in the future
Type of aircraft | 2018 | 2019 | 2020 | 2021 | 2022 | 2023 and later | Total | ||
|---|---|---|---|---|---|---|---|---|---|
Airbus |
| ||||||||
A320neo Family A350 XWB | - - | 25 - | 25 2 | 25 5 | 20 5 | 5 10 | 100 22 | ||
Boeing |
| ||||||||
737 MAX Family 787 Family | 16 6 | 20 2 | 19 - | 21 - | 20 - | — — | 96 8 | ||
EnAraer |
| ||||||||
E175(*) Total | 5 27 | 5 52 | - 46 | - 51 | - 45 | - 15 | 10 236 | ||
"These aircraft can be operated by subsidiaries; they can be leased to third-party regional carriers who will operate the aircraft within the framework of the procurement of carriage capacities.
Cargo revenues increased by 100 million dollars or 14,3% due to the increase in freight volumes.
Other revenues include loyalty program revenues, baggage fees, ticket change fees, airport lounges and lighting services. Other revenues increased by 373 million dollars or 7,6% mainly due to higher profits associated with the loyalty program. Total operating revenues increased by 2,0 billion dollars or 5,0% mainly due to the increase in passenger revenues.
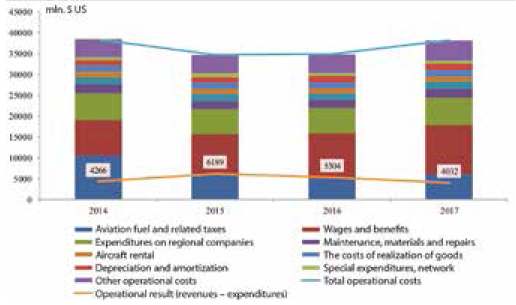
According to the financial report, operating expenses increased by 3,3 billion dollars or 9,5% (see Table 8). An increase in operating expenses was caused mainly by higher fuel costs and higher wage rates for pilots, flight attendants and engineering and technical personnel.
An increase in the costs of maintenance, repairs and materials is due to the changes in contracts: some flight hardware was transferred to the contracts based on paying for logged flight hours, instead of paying for expenses incurred during the maintenance and repairs. An increase in expenses for the sale of tickets is explained by the increase in commissions from higher sales, as well as an increase in award tickets, the commissions for which are higher. Increased depreciation and amortization costs are associated with the fleet renewal program. Other expenses increased due to the improved flight catering and staff training costs.
Table 4
The planned long-term costs for the fleet of AmericanAUSGrouplnc
Liabilities | 2018 | 2019 | 2020 | 2021 | 2022 | 2023 and later | Total |
|---|---|---|---|---|---|---|---|
Contract payments for airplanes and engines | 1826 | 2730 | 2730 | 2858 | 2138 | 1482 | 13764 |
Rental payments | 2195 | 1974 | 1784 | 1339 | 1159 | 3266 | 11717 |
Fixed obligations under the contracts for the sale of capacities with third-party regional carriers | 1457 | 1311 | 1063 | 866 | 699 | 2073 | 7469 |
Rental costs not included in the purchase of carriage capacities | 377 | 355 | 320 | 282 | 239 | 699 | 2272 |
Compared to 2016, in 2017 regional operating expenses increased by 502 million dollars or by 8,3% due to the increased fuel costs (the growth of 54%) and an increase in carriage capacities of mainly the regional companies (an increase of 46% in regional expenditures).
Special expenditures, including expenditures on integration mergers, fleet restructuring, income taxes, payments under labor contracts, etc., have remained practically unchanged.
In 2017 profits before taxes and net revenues amounted to 3,1 billion dollars and $ 1,9 billion dollars, respectively. In 2016 operating profits were 4,3 billion dollars and net profits were 2,7 billion dollars.
Table 9 shows the results of calculations of the cost of a seat-kilometer of the main airline American Airlines by types of aircraft in 2015 2017. The share of direct and indirect costs was approximately the same - 50% each.
Indirect costs are distributed according to the types of planes in proportion to the volume of traffic taking into account the correction factors for the weight of the aircraft and the number of seats.
The following results were obtained for the cost of seat- kilometers of long-haul aircraft operated by AmericanAirlines:
Delta AirLines Inc.
Delta AirLines Inc. performs regular air transportation of passengers and cargo in the United States and around the world. In 2008 the company acquired 100% of the shares of the American airline Northwest Airlines. By early 2010 the operational certificates of both carriers were consolidated into a single certificate.
The main administrative office is located at the international airport Hartsfield-Jackson Atlanta (Atlanta). The destination network is based on American hubs, international hubs and the key airports in Amsterdam, Atlanta, Boston, Detroit, London, Los Angeles, Minneapolis, New York, Paris, Salt Lake City, Seattle and Tokyo. The airline performs air transportation according to the classic model Hub-and-Spoke. Passenger transportation prevails while regional flights collect traffic in one geographic region for the flights operated by long-haul aircraft on international routes. At destination airports the traffic is distributed among regional destinations in another geographic region.
Table 5
Approximate number of active full-time employees as of December 31, 2017
Trade union | Profession | Number of members, people |
|---|---|---|
Mainline: | ||
The American Pilots’ Association (APA) | Pilots | 13 200 |
Association of Professional FlightAttendants (APFA) | Flight attendants | 24 900 |
Passenger Service Employee Association (CWA-IBT) | Passenger service | 16 000 |
The International Association of Macliinists and Aerospace Workers (TWU-IAM) | Mechanics (engineering and technical staff) | 31 400 |
Transport Workers Union (TWU) | Traffic controllers and trainers of flight crews | 750 |
Envoy | ||
The Air Line Pilots Association (ALPA) | Pilots | 2200 |
Association of Flight Attendants (AFA) | Flight attendants | 1300 |
TWU | Mechanics | 5020 |
Conmnmications Workers of America (CWA) | Passenger service | 4300 |
Piedmont | ||
ALPA | Pilots and instructors | 590 |
AFA | Flight attendants | 300 |
International Brotlierhood of Teamsters ((IBT) | Mechanics | 350 |
IBT | Traffic controllers | 70 |
CWA | Aircraft maintenance and passenger service | 3400 |
PSA | ||
ALPA | Pilots | 1500 |
AFA | Flight attendants | 1000 |
IntemationalAssociation of Machinists and Aerospace Workers (IAM) | Mechanics | 350 |
TWU | Traffic controllers | 50 |
Total |
| 106 680 |
Table 6
Fuel costs of American AirIinesGroup Inc., including taxes, in 2014-2017
Year | Fuel consumption, million gallons | Average price per gallon, dollars. | Fuel costs, million dollars. | The share of total expenses, % | Fuel consumption | Year-to year change Price per gallon Fuel costs | The share in total expenses, pts | |
|---|---|---|---|---|---|---|---|---|
2017 | 4352 | 1,73 | 7510 | 19,7 | 0,1 | 21,8 | 21,5 | 2,0 |
2016 | 4347 | 1,42 | 6180 | 17,7 | 0,6 | -17,4 | -17,1 | -3,7 |
2015 | 4323 | 1,72 | 7456 | 21,5 | -0,2 | -40,9 | -40,8 | -11,3 |
2014 | 4332 | 2,91 | 12601 | 32,8 | 1,0 | -5,5 | -A,I | -2,2 |
Delta AirLines Inc. is a member of international joint ventures, alliances with foreign airlines and the global international alliance SkyTeam. It has signed agreements with several regional carriers registered in the United States that operate under the Delta Connection brand.
The airline operates more than 5400 flights daily serving an extensive domestic and international network, which includes 319 destinations in 54 countries. In 2016 Delta had the largest passenger turnover (3 42 billion passenger-kilometers and carriage capacity (405 billion seat-km) among American companies. Its services were used by 184 million passengers.
International alliances. Alliances involve the sharing of codes and loyalty programs for frequent flyers, access to airport lounges. Agreements with some carriers may include the terms of coordination of sales and marketing, co-location of airport facilities, etc.
Table 7
The indicators of efficiency of air transportation for American Airlines Group Inc. in 2014-2017
Indicator | Year ended oi 2017 I 2016 | i December 31 2015 I 2014 | ill | ase (reductk 2016-2015 |
| ||
The main company American Airlines Inc | |||||||
Passenger turnover, million passenger-miles | 201 351 | 199 014 | 199 467 | 195 651 | 1,2 | -0,2 | 2,0 |
Maximum passenger turnover, million seat-miles | 243 806 | 241 734 | 239 375 | 237 522 | 0,9 | 1,0 | 0,8 |
The rate of seat occupancy, % | 82,6 | 82,3 | 83,3 | 82,4 | 0,3* | (1,0)* | 0,9* |
Profitability, cent/passenger-mile | 14,52 | 14,02 | 14,56 | 15,74 | 3,6 | -3,7 | -7,5 |
Profitability of passenger transportation to maximum seat-mile, cent | 11,99 | 11,55 | 12,13 | 12,97 | 3,8 | —4,8 | -6,5 |
Profitability of passenger transportation to maximum seat- kilometer, cent | 7,45 | 7,18 | 7,54 | 8,06 | 3,8 | ^1,8 | -6,5 |
Cost of seat-mile, cent | 12,96 | 11,94 | 12,03 | 13,42 | 8,5 | -0,7 | -10,4 |
Airplanes by the end of the period | 948 | 930 | 946 | 983 | 1,9 | -1,7 | -3,8 |
Fuel consumption, million gallons | 3579 | 3596 | 3611 | 3644 | -0,5 | -0,4 | -0,9 |
Average cost of jet fuel including taxes, dollars/gallon | 1,71 | 1,41 | 1,72 | 2,91 | 21,3 | -18,0 | ^10,9 |
Full-time personnel at end of the period | 103 100 | 101 500 | 98 900 | 94 000 | 1,6 | 2,6 | 5,2 |
Summary data of the main and regional companies of American Airlines Group Inc | |||||||
Passenger turnover, million passenger-miles | 226 346 | 223 477 | 223 010 | 217 870 | 1,3 | 0,2 | 2,4 |
Maximum passenger turnover, million seat-miles | 276 493 | 273 410 | 268 736 | 265 657 | 1,1 | 1,7 | 1,2 |
The rate of seat occupancy, % | 81,9 | 81,7 | 83 | 82 | 0,2* | (1,3)* | 1* |
Profitability, cent/passenger-mile | 15,96 | 15,47 | 15,92 | 17,04 | 3,2 | -2,8 | -6,6 |
Profitability of passenger transportation to maximum seat- mile, cent | 13,07 | 12,65 | 13,21 | 13,97 | 3,3 | —4,2 | -5,4 |
Profitability of passenger transportation to maximum seat- kilometer, cent | 8,12 | 7,86 | 8,21 | 8,68 | 3,9 | -3,6 | -5,0 |
Cost of seat-mile, cent | 15,27 | 14,7 | 15,25 | 16,06 | 0,6 | 0,2 | -1,0 |
Airplanes by the end of the period | 1545 | 1536 | 1533 | 1549 | 0,1 | 0,6 | -0,2 |
Fuel consumption, million gallons | 4352 | 4347 | 4323 | 4332 | 21,8 | -17,4 | -40,9 |
Average cost of jet fuel including taxes, dollars/gallon | 1,73 | 1,42 | 1,72 | 2,91 | 3,5 | 3,2 | 4,6 |
Full-time personnel at end of the period | 126 600 | 122 300 | 118 500 | 113 300 | 1,2 | -0,2 | 2,0 |
* Increase (decrease) by years indicated in paragraphs
Table 8
The main financial and economic results of American Airlines Group Inc. in 2014-2017
Indicator | 2017 | 2016 | 2015 | 2014 |
|---|---|---|---|---|
Revenues from air transportation | ||||
Mainline passengers | 29 238 | 27 909 | 29 037 | 30 802 |
Regional passengers | 6895 | 6670 | 6475 | 6322 |
Freights | 800 | 700 | 760 | 875 |
Otlier revenues | 5262 | 4884 | 4666 | 4677 |
Total operating revenues | 42 195 | 40 163 | 40 938 | 42 676 |
Operating costs: | ||||
Aviation fuel and related taxes | 6128 | 5071 | 6226 | 10592 |
Wages and benefits | 11 804 | 10 881 | 9514 | 8499 |
Expenditures on regional companies | 6572 | 6009 | 5952 | 6477 |
Maintenance, materials and repairs | 1959 | 1834 | 1889 | 2051 |
Otlier fees for rent and boarding | 1806 | 1772 | 1731 | 1727 |
Aircraft rental | 1197 | 1203 | 1250 | 1250 |
The costs of realization of goods | 1477 | 1323 | 1394 | 1544 |
Depreciation and amortization | 1702 | 1525 | 1364 | 1301 |
Special expenditures, network | 712 | 709 | 1051 | 783 |
Otlier operational costs | 4806 | 4532 | 4378 | 4186 |
Total operational costs | 38 163 | 34 859 | 34 749 | 38410 |
Operational result (revenues - expenditures) | 4032 | 5304 | 6189 | 4266 |
Non-production income and expenditures | ||||
Interest income | 215 | 104 | 49 | 32 |
Interest expenses, net | -988 | -906 | -796 | -847 |
Otlier expenses, net | -15 | -59 | -774 | -183 |
Non-production results (income - expenses) | -788 | -861 | -1521 | -998 |
Result before income tax | 3244 | 4443 | 4668 | 3268 |
Income tax | 1322 | 1662 | -3452 | 320 |
Net result | 1922 | 2781 | 8120 | 2948 |
Fig. 1. Changes in the income of American Aairlines Grouplnc. in 2014-2017
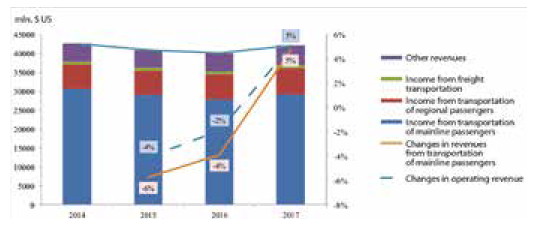
Fig. 2. Changes in operating costs and profits of American Airlines Group Inc. in 2014-2017
Joint Venture Agreements. Currently Delta AirLines Inc. manages five joint ventures: with AirFrance, KLM, and Alitalia to service routes between North America and Europe, with Virgin Atlantic Airways for non-stop flights between the United Kingdom and North America; with Virgin Australia Airlines and its affiliated carriers to service transit routes between North America and Australia, New Zealand, and AeroMexico for cross- border flights between the USA and Mexico. A joint venture with Korean Airlines was also established to operate on trans-Pacific routes between the United States and some Asian countries. However, the company has not yet received the necessary regulatory approvals in Korea. Commercial cooperation has been established with partners within geographic coverage, including the sharing of revenues, profits, or losses on joint routes, as well as joint sales, coordinated pricing, transportation network planning, etc.
Delta has signed agreements with regional carriers that serve passengers in small and medium-sized cities. In 2017 approximately 16% of all Delta passenger traffic was provided by regional air carriers.
There are agreements with the following companies: ExpressJet Airlines, SkyWest Airlines, RepublicAirline, Compass Airlines, GoJetAirlines, Trans States Holdings, and EndeavorAirInc., which is a subsidiary of Delta.
The existing agreements define the mechanisms for purchasing the capacities from regional companies on flights operated under the Delta airline code. Delta AirLines Inc. has the right to receive all revenues associated with these flights. In turn, the agreements determine that Delta pays to regional airlines the amounts calculated on the basis of the costs of the performed flights taking into account the current market conditions. The agreement related to the purchasing of carriage capacities are long-term, usually with the initial terms of at least 10 years, which makes it possible to extend the original terms.
Aircraft fleet. Tables 9 and 10 show the fleet of aircraft and the commitments regarding the supply of aircraft as of December 31, 2017. Table 11 shows the fleet of aircraft operated by regional carriers on behalf of Delta. In 2018 the airline plans to spend about 4,5 billion dollars on the purchase of new aircraft B-737- 900ER, A321-200 and A3 50-900, to make advance payments for A330-900neo and CS100B, as well as on the modernization of passenger compartments of regionally operated aircraft.
Ground Objects. DeltaAirLinesInc. mainly rents a large aircraft maintenance base, various computer rooms, cargo warehouses and training facilities, most of the offices are located at or near the Atlanta airport on the land leased from the city of Atlanta.
Table 9
American Airlines. Estimated costs of seat-kilometer by types of aircraft
Type of aircraft | Year | Fuel consumption, g / seat-km | Payment to flight personnel | Jet fuel | Rent of aircraft | Other costs | Maintenance and repair | Wear and depreciation of flight equipment | Direct flight expenses | Airport costs | Passenger service | Sales and reservations | Other production and administrative costs |
Total indirect costs |
|---|---|---|---|---|---|---|---|---|---|---|---|---|---|---|
737-800 | 2015 | 24.2 | 0.9 | 1.3 | 0.36 | 0.1 | 0.8 | 0.3 | 3.8 | 1.0 | 0.8 | 0.5 | 2.8 | 5.1 |
737-800 | 2016 | 24.3 | 1.0 | 1.1 | 0.38 | 0.0 | 0.9 | 0.4 | 3.8 | 1.1 | 0.9 | 0.5 | 3.0 | 5.6 |
737-800 | 2017 | 24.4 | 1.1 | 1.3 | 0.34 | 0.0 | 1.0- | 0.3 | 4.2 | 1.9 | 1.0 | 0.5 | 1.4 | 4.7 |
757-200 | 2015 | 27.5 | 0.9 | 1.5 | 0.35 | 0.1 | 0.9 | 0.3 | 4.0 | 0.9 | 0.6 | 0.3 | 2.8 | 4.6 |
757-200 | 2016 | 27.6 | 1.0 | 1.2 | 0.32 | 0.0 | 0.9 | 0.3 | 3.8 | 0.9 | 0.6 | 0.3 | 3.0 | 4.9 |
757-200 | 2017 | 28.5 | 1.1 | 1.5 | 0.34 | 0.0 | 1.0 | 0.3 | 4.4 | 1.6 | 0.7 | 0.3 | 1.4 | 4.0 |
767-300/300ER | 2015 | 29.4 | 0.9 | 1.6 | 0.37 | 0.1 | 0.9 | 0.3 | 4.2 | 0.7 | 0.3 | 0.2 | 2.8 | 4.0 |
767-300/300ER | 2016 | 29.1 | 1.0 | 1.3 | 0.38 | 0.1 | 0.9 | 0.4 | 4.0 | 0.9 | 0.4 | 0.2 | 3.0 | 4.5 |
767-300/300ER | 2017 | 30.2 | 1.1 | 1.6 | 0.34 | 0.0 | 1.0 | 0.3 | 4.5 | 1.6 | 0.4 | 0.12 | 1.4 | 3.6 |
777-200ER/200LR | 2015 | 33.06 | 0.9 | 1.9 | 0.37 | 0.1 | 0.9 | 0.3 | 4.4 | 0.6 | 0.2 | 0.1 | 2.8 | 3.7 |
777-200ER/200LR | 2016 | 36.0 | 1.2 | 1.7 | 0.43 | 0.1 | 1.0 | 0.4 | 4.7 | 0.7 | 0.2 | 0.1 | 3.0 | 4.1 |
777-200ER/200LR | 2017 | 31.6 | 1.1 | 1.7 | 0.34 | 0.1 | 1.0 | 0.3 | 4.6 | 1.1 | 0.2 | 0.1 | 1.4 | 2.9 |
777-300/300ER | 2015 | 30.4 | 0.9 | 1.7 | 0.36 | 0.1 | 0.9 | 0.3 | 4.2 | 0.6 | 0.2 | 0.1 | 2.8 | 3.7 |
777-300/300ER | 2016 | 32.1 | 1.0 | 1.5 | 0.38 | 0.1 | 0.9 | 0.4 | 4.2 | 0.6 | 0.2 | 0.1 | 3.0 | 3.9 |
777-300/300ER | 2017 | 30.7 | 1.2 | 1.7 | 0.34 | 0.1 | 1.0 | 0.3 | 4.6 | 0.9 | 0.2 | 0.1 | 1.4 | 2.6 |
A330-300 | 2015 | 26.6 | 0.9 | 1.3 | 0.27 | 0.1 | 0.9 | 0.2 | 3.7 | 0.6 | 0.3 | 0.1 | 2.8 | 3.8 |
A330-300 | 2016 | 26.2 | 0.9 | 1.2 | 0.20 | 0.0 | 0.9 | 0.2 | 3.4 | 0.6 | 0.3 | 0.1 | 3.0 | 4.1 |
A330-300 | 2017 | 26.8 | 1.1 | 1.4 | 0.34 | 0.0 | 1.0 | 0.3 | 4.3 | 1.2 | 0.4 | 0.2 | 1.4 | 3.2 |
A330-100/200 | 2015 | 27.2 | 0.9 | 1.4 | 0.28 | 0.1 | 0.9 | 0.2 | 3.8 | 1.3 | 1.1 | 0.6 | 2.8 | 5.7 |
A330-100/200 | 2016 | 27.3 | 0.9 | 1.2 | 0.21 | 0.0 | 0.9 | 0.2 | 3.4 | 1.4 | 1.1 | 0.6 | 3.0 | 6.1 |
A330-100/200 | 2017 | 27.7 | 1.2 | 1.5 | 0.34 | 0.0 | 1.0 | 0.3 | 4.4 | 2.5 | 1.2 | 0.6 | 1.4 | 5.7 |
A330-200 | 2015 | 27.2 | 0.9 | 1.4 | 0.27 | 0.1 | 0.9 | 0.2 | 3.7 | 0.6 | 0.3 | 0.1 | 2.8 | 3.8 |
A330-200 | 2016 | 26.9 | 0.9 | 1.2 | 0.20 | 0.0 | 0.9 | 0.2 | 3.4 | 0.8 | 0.3 | 0.2 | 3.0 | 4.3 |
A330-200 | 2017 | 28.9 | 1.1 | 1.6 | 0.34 | 0.0 | 1.0 | 0.3 | 4.4 | 1.9 | 0.5 | 0.3 | 1.4 | 4.1 |
A319 | 2015 | 31.1 | 0.9 | 1.6 | 0.31 | 0.1 | 0.9 | 0.2 | 4.1 | 1.6 | 1.2 | 0.6 | 2.8 | 6.2 |
A319 | 2016 | 31.2 | 1.0 | 1.4 | 0.26 | 0.0 | 0.9 | 0.2 | 3.8 | 1.7 | 1.3 | 0.6 | 3.0 | 6.7 |
A319 | 2017 | 31.3 | 1.1 | 1.7 | 0.34 | 0.1 | 1.0 | 0.3 | 4.6 | 3.0 | 1.3 | 0.7 | 1.4 | 6.3 |
A321 | 2015 | 25.3 | 0.9 | 1.3 | 0.31 | 0.1 | 0.9 | 0.2 | 3.7 | 1.0 | 0.8 | 0.5 | 2.8 | 5.1 |
A321 | 2016 | 24.6 | 1.0 | 1.1 | 0.27 | 0.0 | 0.9 | 0.2 | 3.5 | 1.0 | 0.9 | 0.4 | 3.0 | 5.4 |
A321 | 2017 | 24.5 | 1.1 | 1.3 | 0.34 | 0.0 | 0.9 | 0.2 | 4.2 | 1.7 | 0.9 | 0.4 | 1.4 | 4.5 |
B787-800Dreamliner | 2015 | 25.6 | 0.8 | 1.3 | 0.35 | 0.1 | 0.7 | 0.3 | 3.6 | 0.5 | 0.2 | 0.1 | 2.8 | 3.6 |
B787-800Dreamliner | 1016 | 27.3 | 1.0 | 1.3 | 0.39 | 0.0 | 0.9 | 0.4 | 4.0 | 0.5 | 0.2 | 0.1 | 3.0 | 3.8 |
B787-800Dreamliner | 2017 | 26.4 | 1.1 | 1.4 | 0.34 | 0.0 | 1.0 | 0.3 | 4.3 | 0.8 | 0.2 | 0.1 | 1.4 | 2.5 |
B787-900Dreamliner | 2017 | 22.9 | 1.1 | 1.2 | 0.34 | 0.0 | 1.0 | 0.3 | 4.1 | 0.7 | 0.2 | 0.1 | 1.4 | 2.4 |
At airports the company leases ticket counters, passenger lounges (exits), work areas and other terminal space. Delta has entered into agreements on the use of airfields, the use of runways, taxiways and other structures. The landing fee is usually calculated based on the number of landings and the weight of the aircraft.
The leasing contracts are usually valid from one year to 30 years or more. They provide for periodic adjustments in rental rates, landing fees, etc. The tariffs for operational maintenance of aircraft and air transportation are established on contractual basis.
The results of operations are largely affected by fluctuations in the price of aviation fuel (Table 12).
The subsidiaries Delta, Monroe and MIPC own and operate the Trainer refinery, pipelines and terminals. The refinery produces jet fuel, gasoline, diesel and other petroleum products and supplies jet fuel to Delta. In its reports Delta AirLines Inc.
states that the supply of non-reactive fuel from the operation of the refinery contributed to the reduction in the market price of jet fuel.
In 2017 6,0 billion dollars or 19,2%, of total operating expenses were spent on aviation fuel and related taxes.
The largest decline in fuel prices was observed in 2015 compared to 2014 (44%), in 2016 the fall in prices of jet fuel slowed down and stopped in 2017. The basic financial and statistical data of Delta AirLines, Inc. are given in Table 13 and figure 3.
The analysis of operating expenses of Delta AirLines is presented in Table. 14. As of December 31, 2017 approximately 87000 employees worked full time. 19 % of them were members of trade unions.
Таблица 9
DeItaAirLinesInc. Эксплуатационный парк воздушных судов и обязательства по поставкам
Type of aircraft | Current Fleet * | Commitments | ||||||
|---|---|---|---|---|---|---|---|---|
Property | Fin. Leasing | Rent | Total | Average age, years | Purchase | Leasing | Options | |
B-717-200 | 3 | 13 | 75 | 91 | 16,3 | — | — | — |
B-737-700 | 10 | — | — | 10 | 8,9 | — | — | — |
B-737-800 | 73 | 4 | — | 77 | 16,3 | — | — | — |
B-737-900ER | 52 | — | 37 | 89 | 2,3 | 41 | — | — |
B-757-200 | 88 | 9 | 3 | 100 | 20,4 | — | — | — |
B-757-300 | 16 | — | — | 16 | 14,9 | — | — | — |
B-767-300 | 2 | — | — | 2 | 24,5 | — | — | — |
B-767-300ER | 55 | 2 | — | 57 | 21,7 | — | — | — |
B-767-400ER | 21 | — | — | 21 | 17 | — | — | — |
B-777-200ER | 8 | — | — | 8 | 18,1 | — | — | — |
B-777-200LR | 10 | — | — | 10 | 8,8 | — | — | — |
A319-100 | 55 | — | 2 | 57 | 15,8 | — | — | — |
A320-200 | 55 | 3 | 4 | 62 | 22,4 | — | — | — |
A321-200 | 14 | — | 20 | 34 | 0.8 | 93 | — | — |
A321-200neo | — | — | — | — | — | 100 | — | 100 |
A330-200 | 11 | — | — | 11 | 12,8 | — | — | — |
A330-300 | 28 | — | 3 | 31 | 9 | — | — | — |
A330-900neo | — | — | — | — | — | 25 | — | — |
A350-900 | 6 | — | — | 6 | 0.2 | 19 | — | — |
CSlOO | — | — | — | — | — | 75 | — | 50 |
MD-88 | 92 | 17 | — | 109 | 27,5 | — | — | — |
MD-90 | 65 | — | — | 65 | 20,9 | — | — | — |
Total | 664 | 48 | 144 | 856 | 16,7 | 353 | — | 150 |
* With the exception of aircraft operated by regional carriers on behalf of Delta.
In 2017 wages amounted to 30% of costs. In 2015-2016 wages and related expenses increased due to an increase in pilot payment rates (by 18%) as a result of a new contract ratified in December 2016, and an increase in payment rates for other categories of employees (by 14,5%) in December 2015. The increase in wages and related expenses in 2017 is primarily caused by an increase in the number of employees eligible for remuneration.
The increase in expenses for regional carriers is due to the increase in aircraft maintenance, which is partially offset by lower fuel costs.
Annualized depreciation costs increased due to investments in new modifications of the aircraft A330-300, B-737-900ER and CRJ-900 and modification of the interiors of the aircraft in operation.
Maintenance costs are borne in two ways: as they arise or, if stipulated by contracts, based on payments for completed flight hours. The payments under financial leasing agreements are reflected in the costs through the item “depreciation deductions” (the Russian Federation legally approved the item of financial leasing expenses directly attributable to transportation costs).
Operating costs for the leasing of aircraft, which are recorded on a straight-line basis over the lease term, amounted to 1,3 billion dollars in 2016 and 2017 and 1,2 billion dollars in 2015.
Advertising expenses were 284, 277 and 230 million dollars for 2017, 2016 and 2015, respectively.
Analysis of financial indicators. In 2017 earnings before taxes amounted to 5700 million dollars, a decrease of 935 million dollars compared with the previous year mainly due to higher prices of fuel, labor costs, related costs and depreciation costs, which were partially offset by an increase in operating income. Revenues before taxes were adjusted by 101 million dollars taking into account special items (Table 15) and amounted to 5,5 billion dollars.
The operating income increased by 1,6 billion dollars, or 4,0%. Per mile revenues increased by 2,1% compared with 2016. Revenues per passenger for one seat-mile (PRASM) increased due to high tariffs on domestic transportation, the dissemination of special fares, business in the Atlantic region, and high rates in the Caribbean, Central America, Brazil and Mexico.
In 2016 operating expenses decreased by 215 million dollars while consolidated operating costs per seat-mile fell by 2,6% to 13 cents mainly due to lower fuel prices. With the increase in fuel prices in 2017 total operating expenses grew by 2,4 billion dollars while consolidated operating costs per seat-mile (CASM) increased by 6,4% compared with 2016 to 13,81 cents mainly due to higher costs of fuel, wages, related costs and costs of depreciation. The increase in depreciation costs is caused, primarily, by the deliveries of new aircraft including B-737- 900ER, A321 - 200, A330-300 and A350-900, as well as due to the planned decommissioning of the fleet of MD-88 and two B-767-300ER.
Table 10
Delta's commitment to acquire aircraft, units
Type of aircraft | 2018 | 2019 | 2020 | After 2020 | Total |
|---|---|---|---|---|---|
A321-200 | 31 | 32 | 27 | 3 | 93 |
A321-200neo | — | — | 16 | 84 | 100 |
A330-900neo | — | — | 4 | 21 | 25 |
A3 50-900 | 5 | 2 | 2 | 10 | 19 |
B-737-900ER | 23 | 18 | — | — | 41 |
CSlOO | 15 | 25 | 16 | 19 | 75 |
Total | 74 | 77 | 65 | 137 | 353 |
Table 16 shows the results of calculations of the cost of seat- kilometer by types of aircraft of Delta AirLines Inc. in 2015- 2017.
In 2017 the passenger-kilometer profitability increased by I % from 15,9 to 16,0 cent per passenger-mile while due to the growth in seat utilization the seat-mile profitability increased by 2,2% to 13,7 cents. The cost of a seat-mile, adjusted for other expenses not related to operating activities, was 13,2 cents per seat-mile, which is 5,7% more than in 2016. The increase in expenses in 2017 is not offset by the growth in revenues. Therefore, although the airline maintains a positive operating profit, the profitability of air transportation is decreasing.
Table 11
The fleet of aircraft operated by regional carriers on behalf of Delta, units
Carrier | CRJ-200 | CRJ-700 | CRJ-900 | Embraer 170 | Embraer 175 | Total |
|---|---|---|---|---|---|---|
EndeavorAir, Inc.* | 50 | — | 93 | — | — | 143 |
ExpressJet Airlines, Inc.** | — | 33 | 16 | — | — | 49 |
SkyWestAirlines, Inc. | 86 | 27 | 36 | — | 18 | 167 |
Compass Airlines, LLC | — | — | — | — | 36 | 36 |
Republic Airline, Inc. | — | — | — | 20 | 16 | 36 |
GoJet Airlines, LLC | — | 22 | 7 | — | — | 29 |
Total | 136 | 82 | 152 | 20 | 70 | 460 |
* EndeavorAir, Inc. is a subsidiary of Delta.
** During 2017 Delta and ExpressJetAirlinesInc agreed to terminate their relations by the end of 2018.
In 2015-2017 the cost per seat-kilometer corresponding to the average transportation distance was evaluated according to the types of aircraft operated by Delta AirLines:
UnitedAirlines Inc.
United Airlines Inc. is a subsidiary of United Continental Holdings Inc. The operating income and operating expenses of UnitedAirlines Inc. account for almost 100% of the revenue and operating expenses of United Airlines Inc.
Table 12.
DeItaAirLines, Inc. Fuel consumption and the costs of its use
Indicator | 2015 | 2016 | 2017 |
|---|---|---|---|
Consumption, million gallons1 | 3988 | 4016 | 4032 |
Cost, million dollars.1,2 | 7579 | 5985 | 6756 |
Average price per gallon, dollars 1,2 | 1,9 | 1,49 | 1,68 |
The share of total expenses,%, % | 23 | 18,3 | 19,2 |
1 Including operations of regional carriers operating under the contracts of sale.
2 Including the impact of fuel hedging and performance of refining segment.
Table 13
Basicfinancial and statistical data of DeItaAirLines, Inc., 2012-2016
Indicator | 2012 | 2013 | 2014 | 2015 | 2016 | 2017 | Increase / decline
| ||||
2013/2012 | 2014/2013 | 2015/2014 | 2016/2015 | 2017/2016 | |||||||
Passenger turnover, million passenger-miles | 192 974 | 194 988 | 202 925 | 209 625 | 213 098 | 217 712 | I | 4 | 3 | 2 | 2 |
Seat turnover, million seat-miles | 230 415 | 232740 | 239 676 | 246 764 | 251 867 | 254 325 | I | 3 | 3 | 2 | I |
Revenues from passenger transportation, mill, dollars | 31 754 | 32 942 | 34 954 | 34 782 | 33 777 | 34 819 | 4 | 6 | 0 | 3 | 3 |
Revenues from cargo transportation, mill, dollars | 990 | 937 | 934 | 813 | 668 | 729 | -5 | -0,3 | -13 | -18 | 9 |
Otlier income, million dollars | 3926 | 3894 | 4474 | 5109 | 5194 | 5696 | -I | 15 | 14 | 2 | 10 |
Total operating income, million dollars | 36 670 | 37 773 | 40 362 | 40 704 | 39 639 | 41 244 | 3 | 7 | I | -3 | 4 |
Operating expenses, million dollars | 34 268 | 33 981 | 38 156 | 32 902 | 32 687 | 35 130 | -I | 12 | -14 | -I | 7 |
Profitability of passenger-mile, cent | 16,5 | 16,89 | 17,2 | 16,6 | 15,9 | 16 | 3 | 2 | -4 | -4 | I |
Profitability of seat-mile, cent | 13,8 | 14,2 | 14,6 | 14,1 | 13,4 | 13,7 | 3 | 3 | -3 | -5 | 2 |
Cost of seat-mile, cent | 15,0 | 14,8 | 15,9 | 13,3 | 13,0 | 13,8 | -I | 8 | 16 | -3 | 6 |
Passenger load factor,% | 83,8 | 83,8 | 84,7 | 84,9 | 84,6 | 85,6 | 0 | 1,1 | 0,2 | -0,4 | I |
Puel consumption, million gallons | 3769 | 3828 | 3893 | 3988 | 4016 | 4032 | 2 | 2 | 2 | I | 0 |
Specific fuel consumption, g/seat-mile | 16,26 | 16,45 | 16,24 | 16,16 | 15,94 | 15,85 | I | -I | -I | -I | -I |
Average price per gallon of fuel, dollars | 3,3 | 3,0 | 3,5 | 1,9 | 1,5 | 1,68 | -8 | 16 | ^15 | -22 | 12 |
Staff at the end of the period, persons | 73 561 | 77 755 | 79 655 | 82 949 | 83 756 | 86 564 | 6 | 2 | 4 | I | 3 |
Table 14
Operating expenses of DeItaAirLines, Inc. million dollars
Indicator | Year ended on December 31 | Increase/decrease | ||||||||
|---|---|---|---|---|---|---|---|---|---|---|
Absolute | Relative, % | |||||||||
2014 | 2015 | 2016 | 2017 | 2015- 2014 | 2016-2015 | 2017- 2016 | 2015/2014 | 2016/2015 | 2017/2016 | |
Wages and related expenses | 8120 | 8776 | 10 034 | 10436 | 656 | 1258 | 402 | 8 | 14 | 4 |
Aviation fuel and related taxes | 11668 | 6544 | 5133 | 5733 | -5124 | -1411 | 600 | -44 | -22 | 12 |
Expenses of regional carriers | 5237 | 4241 | 4311 | 4503 | -996 | 70 | 192 | -19 | 2 | 4 |
Contractual services | 1828 | 1848 | 1991 | 2235 | 20 | 143 | 244 | I | 8 | 12 |
Depreciation and amortization | 1749 | 1835 | 1902 | 2184 | 86 | 67 | 282 | 5 | 4 | 15 |
Materials for repair and maintenance of aircraft | 1771 | 1848 | 1823 | 1992 | 77 | -25 | 169 | 4 | -I | 9 |
Passenger fees and other selling expenses | 1700 | 1672 | 1710 | 1787 | -28 | 38 | 77 | -2 | 2 | 5 |
Boarding fees and rental payments at airports | 1442 | 1493 | 1490 | 1528 | 51 | -3 | 38 | 4 | -0,2 | 3 |
Profit sharing | 1085 | 1490 | 1115 | 1067 | 405 | -375 | M8 | 37 | -25 | -4 |
Passenger service | 810 | 872 | 907 | 1065 | 62 | 35 | 158 | 8 | 4 | 17 |
Rental of aicraft | 233 | 250 | 285 | 351 | 17 | 35 | 66 | 7 | 14 | 23 |
Restructuring and other | 716 | 35 | — | — | -681 | — | — | -95 | — | — |
Otlier | 1797 | 1998 | 1986 | 2249 | 201 | -12 | 263 | 11 | -0,6 | 13 |
Total operating costs | 38 156 | 32 902 | 32 687 | 35130 | -5254 | -180 | 2443 | -14 | -0,7 | 7 |
Fig. 3 Analysis of operational data of DeItaAirLines, Inc. for 2012-2016.
The data are given in the metric measurement system: a - analysis of passenger and seat turnover; b - analysis of personnel wages; с - analysis of fuel costs; d - analysis of profitability and costs; e - analysis of profit to seat-km
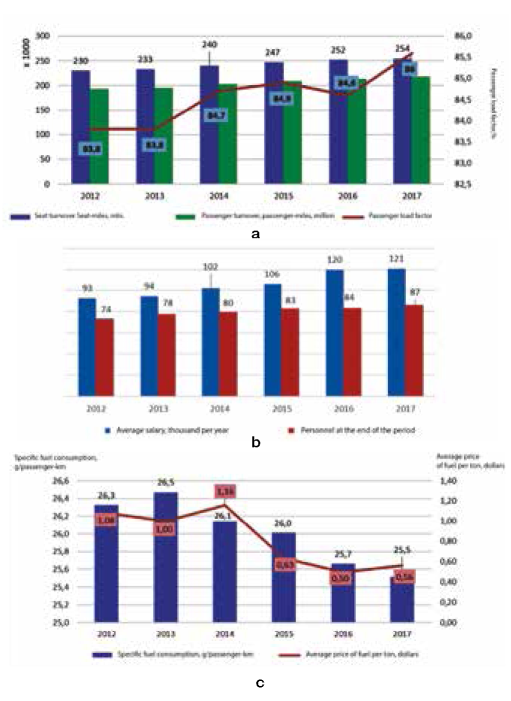
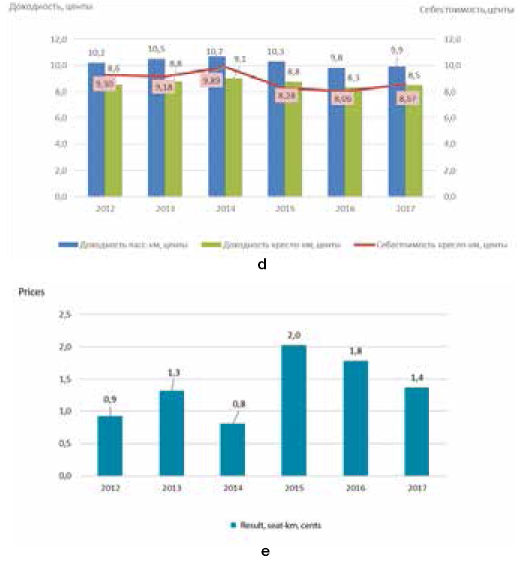
Table 15
Special revenuese and expenses (recalculation at market prices)
Indicator | 2012 | 2013 | 2014 | 2015 | 2016 | 2017 |
|---|---|---|---|---|---|---|
Adjustments and calculations by MTM * | 27 | 276 | -2346 | 1301 | 450 | 259 |
Restructuring and other | -452 | -424 | -716 | -35 | — | — |
Losses from repayment of debts | -118 | — | -268 | — | — | — |
MTM Inveshnent Adjustments | — | — | -134 | 26 | 115 | -8 |
Tax Exemption (* *) | — | 7989 | — | — | — | -150 |
Total income (loss) | -543 | 7841 | -3464 | 1292 | 565 | 101 |
* Revaluation based on the current level of market prices (mark to market).
** State benefits
Table 17
UnitedAirIinesInc. Fuel consumption and the costs of its use
Indicator | Jet fuel consumption, million gallons | Jet fuel consumption, million dollars | Average price per gallon, dollar | Average price of I ton, dollar | Share of total expenses, % |
|---|---|---|---|---|---|
2014 | 3905 | 11675 | 2,99 | 997 | 32 |
2015 | 3886 | 7522 | 1,94 | 647 | 23 |
2016 | 3904 | 5813 | 1,49 | 497 | 18 |
2017 | 3978 | 6913 | 1,74 | 580 | 20 |
UnitedAirlines Inc. is one of the largest airlines in the USA and in the world. According to the results of 2017, its services were used by 148 million passengers, the passenger turnover was 311,318 billion passenger-km and total revenues -37,736 billion dollars.
In 2002 United Airlines Inc. declared bankruptcy, the reason for which was its inability to pay almost I billion dollars of debt. In 2005 the company obtained finances - 3 billion dollars and presented a recovery plan after the state of bankruptcy. After that merger negotiations were held with Continental Airlines. In May 2010 the company UAL, which owned the UnitedAirlines Inc., officially announced the purchase of Continental Airlines for 3,17 billion dollars. The transaction took place in the form of an exchange of shares. Since 2011 the airline operates under a single valid certificate from the United States Federal Aviation Administration.
Together with subsidiary carriers operating under the trademark of United Express (Republic, Champlain Enterprises, Commut Air, ExpressJet, GoJet, Mesa, Sky West, Air Wisconsin and Trans States), United Airlines Inc. serves an unprecedented according to its size network - the entire territory of the United States, Asia, Australia, Europe and the Middle East.
Table 18
United Airlines Inc. The main company’s long-haul fleet
Type of aircraft | Total | Ownership | Rent | Standard configuration of seats | Average age, years |
|---|---|---|---|---|---|
777-300ER | 14 | 14 | — | 366 | 0,7 |
777-200ER | 55 | 40 | 15 | 267-269 | 17,8 |
777-200 | 19 | 19 | — | 364 | 20,5 |
787-9 | 21 | 21 | — | 252 | 2,1 |
787-8 | 12 | 12 | — | 219 | 4,5 |
767-400ER | 16 | 14 | 2 | 242 | 16,3 |
767-300ER | 35 | 22 | 13 | 183-214 | 22,5 |
757-300 | 21 | 9 | 12 | 213 | 15,3 |
757-200 | 56 | 50 | 6 | 142-169 | 21,7 |
737-900ER | 136 | 136 | — | 179 | 5 |
737-900 | 12 | 8 | 4 | 179 | 16,3 |
737-800 | 141 | 77 | 64 | 154-166 | 13,8 |
737-700 | 40 | 20 | 20 | 118-126 | 18,8 |
A320-200 | 99 | 66 | 33 | 150 | 19,3 |
A319-100 | 67 | 50 | 17 | 128 | 16,7 |
Total | 744 | 558 | 186 | — | 14,3 |
Table 16
Estimated costs of seat-kilometer by type of aircraft of DeItaAirLinesInc. in 2015-2017
Type of aircraft | Year | Fuel consumption, g / seat-km | Remuneration of flight personnel | Aviation fuel | Rental of aircraft | Other flight expenses | Maintenance | Depreciation and amortization of flight equipment Direct (flight costs) | Airport expenses | Passenger services | Sales and reservations | Other production and administrative expenses |
Total indirect costs |
737-700 | 2015 | 30,6 | 1,4 | 2,0 | 0,2 | 0,015 | 1,0 | 0,7 5,2 | 2,6 | 1,0 | 0,8 | 2,2 | 6,7 |
737-700 | 2016 | 30,9 | 1,6 | 1,5 | 0,1 | 0,006 | 1,0 | 0,7 5,0 | 2,7 | 1,1 | 0,8 | 2,2 | 6,8 |
737-700 | 2017 | 30,6 | 1,8 | 1,6 | 0,1 | 0,005 | 1,2 | 0,8 5,6 | 6,1 | 1,6 | 1,1 | 2,2 | 11,1 |
737-800 | 2015 | 23,9 | 1,0 | 1,5 | 0,1 | 0,011 | 0,7 | 0,5 3,8 | 1,3 | 0,6 | 0,5 | 2,2 | 4,5 |
737-800 | 2016 | 24,0 | 1Д | 1,2 | 0,1 | 0,004 | 0,8 | 0,5 3,7 | 1,4 | 0,7 | 0,5 | 2,2 | 4,6 |
737-800 | 2017 | 23,9 | 1,2 | 1,3 | 0,1 | 0,004 | 0,9 | 0,6 4,1 | 2,9 | 0,9 | 0,6 | 2,2 | 6,7 |
737-900 | 2015 | 16,7 | 0,6 | 1Д | 0,1 | 0,002 | 0,5 | 0,3 2,6 | 1,3 | 0,6 | 0,5 | 2,2 | 4,6 |
737-900 | 2016 | 22,1 | 1,0 | 1Д | 0,1 | 0,004 | 0,7 | 0,4 3,3 | 1,5 | 0,7 | 0,5 | 2,2 | 4,9 |
737-900 | 2017 | 22,1 | 1,1 | 1,2 | 0,1 | 0,004 | 0,8 | 0,5 3,7 | 3,2 | 1,1 | 0,7 | 2,2 | 7,2 |
757-200 | 2015 | 26,5 | 0,9 | 1,7 | 0,1 | 0,009 | 0,7 | 0,4 3,8 | 1,8 | 0,7 | 0,5 | 2,2 | 5,2 |
757-200 | 2016 | 25,2 | 1,0 | 1,3 | 0,1 | 0,004 | 0,6 | 0,4 3,4 | 1,6 | 0,7 | 0,5 | 2,2 | 4,9 |
757-200 | 2017 | 25,0 | 1,1 | 1,3 | 0,1 | 0,003 | 0,7 | 0,5 3,7 | 3,5 | 0,9 | 0,6 | 2,2 | 7,3 |
757-300 | 2015 | 22,3 | 0,6 | 1,4 | 0,1 | 0,007 | 0,5 | 0,3 3,0 | 1,4 | 0,6 | 0,5 | 2,2 | 4,7 |
757-300 | 2016 | 22,0 | 0,7 | 1Д | 0,1 | 0,003 | 0,5 | 0,3 2,8 | 1,4 | 0,7 | 0,5 | 2,2 | 4,7 |
757-300 | 2017 | 22,0 | 0,8 | 1,2 | 0,1 | 0,003 | 0,6 | 0,4 3,1 | 3,4 | 1,0 | 0,7 | 2,2 | 7,3 |
767-400 | 2015 | 27,4 | 0,7 | 1,8 | 0,1 | 0,006 | 0,4 | 0,3 3,3 | 0,8 | 0,2 | 0,1 | 2,2 | 3,3 |
767-400 | 2016 | 27,4 | 0,8 | 1,4 | 0,1 | 0,003 | 0,4 | 0,3 3,0 | 0,8 | 0,2 | 0,1 | 2,2 | 3,3 |
767-400 | 2017 | 27,4 | 0,9 | 1,5 | 0,1 | 0,002 | 0,5 | 0,3 3,3 | 1,9 | 0,3 | 0,2 | 2,2 | 4,7 |
767-300 | 2015 | 28,1 | 0,8 | 1,8 | 0,1 | 0,007 | 0,5 | 0,3 3,5 | 0,9 | 0,2 | 0,2 | 2,2 | 3,5 |
767-300 | 2016 | 28,2 | 0,9 | 1,4 | 0,1 | 0,003 | 0,5 | 0,3 3,2 | 0,9 | 0,3 | 0,2 | 2,2 | 3,5 |
767-300 | 2017 | 28,6 | 1,0 | 1,5 | 0,1 | 0,003 | 0,6 | 0,4 3,6 | 1,8 | 0,3 | 0,2 | 2,2 | 4,6 |
777-200 | 2015 | 30,2 | 0,7 | 1,9 | 0,1 | 0,005 | 0,4 | 0,2 3,3 | 0,6 | 0,1 | 0,1 | 2,2 | 3,0 |
777-200 | 2016 | 29,9 | 0,8 | 1,5 | 0,1 | 0,002 | 0,4 | 0,2 2,9 | 0,7 | 0,2 | 0,1 | 2,2 | 3,1 |
777-200 | 2017 | 29,6 | 0,9 | 1,6 | 0,0 | 0,002 | 0,4 | 0,3 3,2 | 1,6 | 0,2 | 0,2 | 2,2 | 4,2 |
747-400 | 2015 | 34,7 | 0,5 | 2,2 | 0,0 | 0,003 | 0,3 | 0,2 3,2 | 0,7 | 0,2 | 0,1 | 2,2 | 3,2 |
747-400 | 2016 | 35,0 | 0,6 | 1,7 | 0,0 | 0,002 | 0,3 | 0,2 2,8 | 0,6 | 0,1 | 0,1 | 2,2 | 3,0 |
747-400 | 2017 | 35,1 | 0,7 | 1,9 | 0,0 | 0,001 | 0,3 | 0,2 3,1 | 1,7 | 0,2 | 0,2 | 2,2 | 4,2 |
A330-300 | 2015 | 25,6 | 0,6 | 1,6 | 0,1 | 0,006 | 0,4 | 0,2 2,9 | 0,7 | 0,2 | 0,1 | 2,2 | 3,2 |
A330-300 | 2016 | 25,5 | 0,7 | 1,3 | 0,1 | 0,002 | 0,4 | 0,2 2,6 | 0,8 | 0,2 | 0,2 | 2,2 | 3,3 |
A330-300 | 2017 | 25,3 | 0,7 | 1,3 | 0,0 | 0,002 | 0,4 | 0,3 2,9 | 1,8 | 0,4 | 0,2 | 2,2 | 4,6 |
A330-200 | 2015 | 30,5 | 0,9 | 2,0 | 0,1 | 0,007 | 0,5 | 0,3 3,7 | 0,6 | 0,1 | 0,1 | 2,2 | 3,1 |
A330-200 | 2016 | 30,9 | 1,0 | 1,5 | 0,1 | 0,003 | 0,5 | 0,3 3,3 | 0,7 | 0,2 | 0,1 | 2,2 | 3,2 |
A330-200 | 2017 | 30,7 | 1,1 | 1,6 | 0,1 | 0,002 | 0,5 | 0,4 3,7 | 1,8 | 0,3 | 0,2 | 2,2 | 4,4 |
A320 | 2015 | 28,0 | 1,1 | 1,8 | 0,1 | 0,012 | 0,8 | 0,5 4,4 | 2,0 | 0,9 | 0,7 | 2,2 | 5,8 |
A320 | 2016 | 27,3 | 1,3 | 1,4 | 0,1 | 0,005 | 0,8 | 0,5 4,1 | 2,0 | 0,9 | 0,7 | 2,2 | 5,8 |
A320 | 2017 | 26,5 | 1,3 | 1,4 | 0,1 | 0,004 | 0,9 | 0,6 4,4 | 4,0 | 1,2 | 0,9 | 2,2 | 8,3 |
A319 | 2015 | 33,6 | 1,7 | 2,2 | 0,2 | 0,023 | 1,5 | 1,0 6,6 | 2,7 | 1,1 | 0,9 | 2,2 | 6,8 |
A319 | 2016 | 31,4 | 1,6 | 1,6 | 0,1 | 0,006 | 1,0 | 0,6 4,9 | 2,2 | 1,0 | 0,7 | 2,2 | 6,1 |
A319 | 2017 | 30,1 | 1,6 | 1,6 | 0,1 | 0,005 | 1Д | 0,8 5,2 | 4,4 | 1,3 | 0,9 | 2,2 | 8,9 |
A321 | 2016 | 26,9 | 1,4 | 1,4 | 0,1 | 0,005 | 0,7 | 0,5 4,1 | 3,5 | 1,8 | 1,3 | 2,2 | 8,8 |
A321 | 2017 | 25,9 | 1,3 | 1,4 | 0,1 | 0,004 | 0,8 | 0,6 4,1 | 6,9 | 2,3 | 1,6 | 2,2 | 13,0 |
‘ Wages, materials, spare parts.
Table 19
UnitedAirIinesInc. The fleet of regional carriers
Type of aircraft | Total | Ownership | Rent | Regional aircraft operators | Regional operators | Number of planes | Standard configuration of seats |
|---|---|---|---|---|---|---|---|
EmbraerE 175 | 152 | 54 | — | 98 | SkyWest: | 65 | 76 |
|
|
|
|
| Mesa: Republic: | 59 28 |
|
Embraerl 70 | 38 | — | — | 38 | Republic: | 38 | 70 |
CRJ700 | 65 | — | — | 65 | SkyWest: | 20 | 70 |
|
|
|
|
| GoJet: Mesa: | 25 20 |
|
CRJ200 | 85 | — | — | 85 | SkyWest: | 55 | 50 |
|
|
|
|
| AirWisconsin: | 30 |
|
ERJ145 (XR/LR/ER) | 168 | 29 | 139 | — | ExpressJet: | 110 | 50 |
|
|
|
|
| TransStates: ConmiutAir: | 36 22 |
|
Q200* | 7 | — | - | 7 | ConmiutAir: | 7 | 37 |
EmbraerERJl 35* | 3 | — | 3 | — | ExpressJet: | 3 | 37 |
Total regional aircraft Total fleet of aircraft | 518 1262 | 83 641 | 142 328 | 293 293 |
| 518 |
|
* In January 2018 a joint service of aircraft of the type Q200 and ERJ 135 was put into operation.
United Airlines Inc. operates flights from Newark, Chicago, Denver, Houston, Los Angeles, Guam, San Francisco and Washington airports.
Airline United Airlines Inc. and its regional carriers operate more than 4500 flights a day to 338 destination airports on five continents. The main company manages tariffs, prices, revenues, miles calculation, loyalty programs, etc.
United Airlines Inc. is a member of the Star Alliance, the global integrated airline network and the largest airline alliance in the world. As of January I, 2018 the StarAlliance airlines served 1300 airports in 191 countries with 18400 daily flights.
In addition to UnitedAirlines Inc. the alliance includes: Adria Airways, Aegean Airlines, Air Canada, Air China, Air India, Air New Zealand, AU Nippon Airways, Asiana Airlines, Austrian Airlines, Avianca, Avianca Brasil, Brussels Airlines, Copa Airlines, Croatia Airlines, EgyptAir, Ethiopian Airlines, EVA Air, LOT Polish Airlines, Lufthansa, SAS, Shenzhen Airlines, Singapore Airlines, South African Airways, SWISS, TAP Air Portugal, THAIAirways International and TurkishAirlines.
United Airlines Inc. также организовала трансатлантические совместные предприятия с Air Canada, Lufthansa, ANA и Air New Zealand.
Regional companies. United Airlines Inc. concludes agreements with the above-listed regional companies about the purchasing of capacities, the peculiarity of which is the provision of a certain number of regional aircraft with a capacity of up to 76 seats, the conclusion of pilot contracts, the performance of flights according to the flight schedules of UnitedAirlines Inc.
United Airlines Inc. pays to regional carriers the agreed (controlled) expenses for the performed flights and incentive amounts. The controlled expenses are paid at specific rates of regional carriers’ operating expenses, for example, the cost of crews, maintenance and ownership of aircraft are determined by multiplying the static values of the costs for aircraft types by the corresponding flight hours. In accordance with agreements on the purchasing of capacities, the cost of jet fuel, take-off and landing charges, and other expenses directly incurred by regional carriers are compensated by UnitedAirlines Inc. with fixed amounts.
Aviation fuel. Table 17 shows the consumption of jet fuel during 2014-2017. As of December 31, 2017 United Airlines inc. did not have contracts on fuel hedging.
As of December 31, 2017 UnitedAirlines Inc., including its subsidiaries, had about 89800 employees. Approximately 80% of United Airlines Inc. employees were members of various US trade union organizations.
As of December 31, 2017 the combined fleet of the company (the aircraft of the main company and aircraft of regional carriers) totaled 1262 planes (Tables 18, 19). The main airline owned 558 aircraft, or 75%.
As of December 31, 2017 United Airlines Inc. had firm obligations to acquire Boeing and Airbus aircraft (Table 20).
Table 21 shows the planned United Airlines Inc. capital expenditures on the purchase of aircraft, spare engines, aircraft upgrades and other aircraft-related capital expenditures as of December 31, 2017.
Table 20.1
United Airlines Inc. Obligations to acquire aircraft in 2018-2027
Type of aircraft | Number |
|---|---|
Airbus A3 50 | 45 |
Boeing 737 MAX | 161 |
Boeing 777-300ER | 4 |
Boeing 787 | 18 |
Total | 228 |
In 2018, 13 aircraft were delivered, including:
The market valuation of the received new aircraft corresponding to the specified types is indicated.
Until the end of 2018 three aircraft of the type 737 Max 9, one of the type 777-300 and three of the type 787-9 will be delivered.
UnitedAirlines Inc. rents infrastructure facilities: equipment and premises of airports, hangars, terminals and buildings. The main rental facilities are located at the airports of San Francisco, Washington Dulles, Chicago, Los Angeles, Denver, Newark, Houston, Cleveland and Guam.
The financial and economic indicators of United Airlines Inc. in 2014-2017 are presented in Table 22.
UAL's net profit in 2017 was 2,1 billion dollars.
Compared with 2016: passenger transportation increased by 3,4%; the total revenues increased by 3,23%; passenger revenues per available seat-mile (PRASM) decreased by 0,4%; the cost of a seat-mile increased by 2,76%; the cost of aviation fuel in 2017 increased mainly due to the increase in fuel prices (by 16,8%).
During 2017, UAL delivered new aircraft: three Boeings 787-9, four Boeings 737-800, 12 Boeings 777-300ER, 24 new Embraer E175 and two used A320 and six A319.
The changes in revenues by region in 2017 compared to 2015-2016 are shown in Table. 23. The main contribution to the growth of revenues was made by domestic flights in the USA and Canada.
Table 23
UnitedAirIinesInc. Changes in revenues by regions of passenger transportation in 2017
Region | 2015 | 2016 | 2017 | 2016 to 2015 | 2017 to 2016 |
|---|---|---|---|---|---|
Domestic (USA and Canada) | 21931 | 22202 | 23131 | 271 | 929 |
Pacific Ocean | 5498 | 4959 | 4898 | -539 | -61 |
Atlantic Ocean | 7068 | 6157 | 6285 | -911 | 128 |
LatinAmerica | 3367 | 3238 | 3422 | -129 | 184 |
Total | 37864 | 36556 | 37736 | -1308 | 1180 |
Operating expenses. Table 24 shows the company's operating expenses in 2014-2017. Compared to 2016, in 2017 wages and related expenses increased by 770 million dollars or by 7,5% mainly due to higher rates of payment and expenses for benefits arising from collective agreements concluded in 2016. The costs of aviation fuel increased by 1,1 billion dollars or by 18,9% mainly due to the rising fuel prices and increased carriage capacities by 3,5%. Airport expenses increased by 75 million dollars or 3,5% in 2017 compared to the period of the previous year due to higher rates of rent and landing. The costs of acquiring regional capacities increased by 3 5 million dollars or 1,6% due to an increase in annual rates of payments and profitability.
At the same time the regional potential decreased by 3,8%. Depreciation increased by 172 million dollras or 8,7%, mainly due to an increase in the fleet of new planes, modernization of aircraft and an increase in information infrastructure. The costs of materials for aircraft maintenance and repairs by outside organizations increased by 107 million dollars or 6,1% due to an increase in the number of repairs of planes and engines and additional repair of wireless equipment (for entertainment).
Table 21
United Airlines Inc. Obligations to acquire aircraft, billion dollars
Year | Obligations |
|---|---|
2018 | 3,2 |
2019 | 2,9 |
2020 | 2,1 |
2021 | 2,4 |
2022 | 1,8 |
After 2022 | 9,8 |
Total | 22,2 |
Рис. 4. Изменения себестоимости перевозок по дальности перевозок по авиакомпаниям:
a - American Airlines Inc.; b - Delta AirLines Inc.; с - United AirLines Inc.
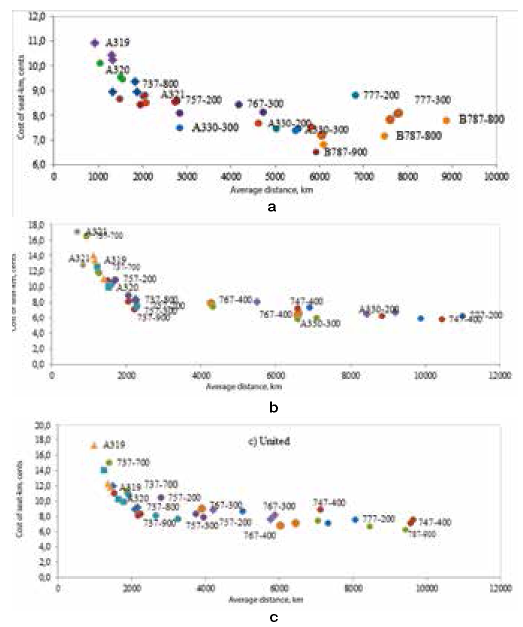
Table 22
UnitedAirIinesInc. Selected financial data for 2014-2017
| Indicator | The value of indicators for the period 2012-2017 | Changes in 2016-2017 | ||||||
|---|---|---|---|---|---|---|---|---|
2012 | 2013 | 2014 | 2015 | 2016 | 2017 | 2016/2015 | 2017/2016 | |
| The main destinations | ||||||||
Transportation of passengers, million | 93,6 | 91,3 | 91,5 | 96,3 | 101,0 | 108,0 | 4,86 | 6,94 |
Passenger-miles, billion | 179,4 | 178,6 | 179 | 183,6 | 186,2 | 193,4 | 1,38 | 3,90 |
Seat-miles, billion | 216,3 | 213 | 214,1 | 220,0 | 224,7 | 234,6 | 2,14 | 4,40 |
Freight ton-miles, billion | 2,5 | 2,2 | 2,5 | 2,614 | 2,805 | 3,316 | 7,31 | 18,22 |
Seat occupancy rate | 0,829 | 0,838 | 0,836 | 0,835 | 0,829 | 0,825 | -0,006 | -0,004 |
Revenues from passenger transportation, billion dollars | 25,808 | 25,987 | 26,785 | 26,333 | 25,414 | 26,552 | -3,49* | 4,48 |
Revenues from passenger transportation per seat- mile, cent | 11,9 | 12,2 | 12,5 | 11,97 | 11,31 | 11,32 | -5,51 | 0,09 |
Gross revenues per seat-mile, cent | 13,9 | 14,5 | 14,8 | 14,19 | 13,5 | 13,51 | -4,86 | 0,07 |
Total revenues per passenger-mile (profitability), cent | 14,4 | 14,6 | 15 | 14,34 | 13,65 | 13,73 | —4,81 | 0,59 |
Cost of a seat-mile, cent | 14,1 | 14,3 | 14 | 12,42 | 12,22 | 12,59 | -1,61 | 3,03 |
Average price of a gallon of fuel, thousand dollars | 3,27 | 3,12 | 2,98 | 1,96 | 1,49 | 1,72 | -23,98 | 15,44 |
Fuel consumption, million gallons | 3275 | 3204 | 3183 | 3216 | 3261 | 3357 | 1,40 | 2,94 |
Average nonstop range, miles | 1895 | 1934 | 1958 | 1922 | 1859 | 1806 | -3,28 | -2,85 |
Average daily flying time, hours | 10:38 | 10:28 | 10:26 | 10:24 | 10:06 | 10:27 | -2,88 | 3,47 |
Summary data | ||||||||
Transportation of passengers, million | 140,4 | 139,2 | 138 | 140 | 143 | 148 | 2,00 | 3,42 |
Passenger-miles, billion | 205,5 | 205,2 | 205,6 | 209 | 210 | 216 | 0,81 | 2,83 |
Seat-miles, billion | 248,9 | 245,4 | 246 | 250 | 254 | 262 | 1,43 | 3,47 |
Seat occupancy rate | 82,6 | 83,6 | 83,6 | 0,834 | 0,829 | 0,824 | -0,005 | -0,005 |
Operating income, total, billion dollars. | 37,152 | 38,279 | 38,901 | 37,864 | 36,556 | 37,736 | -3,45 a) | 3,23 |
Income from passenger transportation, billion dollars | 32,583 | 33,122 | 33,762 | 32,765 | 31,457 | 32,404 | -3,99 | 3,01 |
Income from freight transportation, billion dollars | 1,018 | 0,882 | 0,938 | 0,937 | 0,876 | 1,035 | -6,51 | 18,15 |
Other income, billion dollars. | 3,551 | 4,275 | 4,101 | 4,142 | 4,223 | 4,297 | 1,96 | 1,75 |
Operating expenses, billion dollars | 37,113 | 3,703 | 36,528 | 32,696 | 32,215 | 34,236 | -1,47 | 6,27 |
Operating result, million dollars | 39 | 1249 | 2373 | 5168 | 4341 | 3500 | -16,00 | -19,37 |
Net income, million dollars | -723 | 571 | 1132 | 7301 | 2264 | 2149 | -68,99 | -5,08 |
PRASM (Passenger revenue per available seat-mile), cent | 13,09 | 13,5 | 13,72 | 13,11 | 12,4 | 12,35 | -5,42 | -0,40 |
Total revenues per seat-mile, cent | 14,9 | 15,6 | 15,8 | 15,15 | 14,42 | 14,38 | —4,82 | -0,28 |
Total revenues per passenger-mile (profitability), cent | 15,9 | 16,1 | 16,4 | 15,72 | 14,96 | 14,98 | ^i,83 | 0,13 |
Cost of a seat-mile, cent | 14,91 | 15,09 | 14,85 | 13,08 | 12,7 | 13,05 | -2,91 | 2,76 |
Average price of a gallon of fuel, thousand dollars | 3,27 | 3,13 | 2,99 | 1,94 | 1,49 | 1,74 | -23,20 | 16,78 |
Fuel consumption, million gallons | 4016 | 3947 | 3909 | 3886 | 3904 | 3978 | 0,46 | 1,90 |
Average nonstop range, mile | 1429 | 1445 | 1480 | 1487 | 1473 | 1460 | -0,94 | -0,88 |
* Increase (decrease) by year is indicated in items
Table 24
United Airlines Inc. The analysis of operating expenses in 2014-2017
Indicator | 2014 | 2015 | 2016 | 2017 | Increase (decrease) absolute, million dollars relative, % | |||
|---|---|---|---|---|---|---|---|---|
2016/2015 | 2017/2016 | 2016/2015 | 2017/2016 | |||||
Wages and related expenses | 8935 | 9713 | 10275 | 11045 | 562 | 770 | 5,8 | 7,5 |
Fuel costs | 11675 | 7522 | 5813 | 6913 | -1709 | 1100 | -22,7 | 18,9 |
Landing fees, rentals and other expenses at airports | 2274 | 2203 | 2165 | 2240 | -38 | 75 | -L7 | 3,5 |
Payment for the capacities of regional carriers | 2344 | 2290 | 2197 | 2232 | -93 | 35 | —4,1 | 1,6 |
Depreciation and amortization | 1679 | 1819 | 1977 | 2149 | 158 | 172 | 8,7 | 8,7 |
Repair and maintenance of aircraft | 1779 | 1651 | 1749 | 1856 | 98 | 107 | 5,9 | 6,1 |
Distribution costs (Sales network) | 1373 | 1342 | 1303 | 1349 | -39 | 46 | -2,9 | 3,5 |
Rent of aircraft | 883 | 754 | 680 | 621 | -74 | -59 | -9,8 | -8,7 |
Special expenses | 443 | 326 | 638 | 176 | 312 | —462 | 95,7 | -72,4 |
Other operating expenses | 5143 | 5078 | 5421 | 5667 | 343 | 246 | 6,8 | 4,5 |
Total | 36528 | 32698 | 32218 | 34238 | —480 | 2020 | -1,5 | 6,3 |
The leasing of planes decreased by 59 million dollars or 8,7% due to the acquisition of aircraft and lower rental rates. Other operating expenses increased by 236 million dollars or 4,4% due to the increased costs of onboard catering, marketing and technologies related to customer service, as well the increase in freight transportation.
At the end of 2017 operating expenses increased by 2,02 billion dollars, the revenues increased by 1,18 billion, the operating result decreased from 4341 million dollars in 2016 to 3500 million dollars in 2017 or by 19,4%.
Table 25 shows the results of calculations of the cost per seat- kilometer by types of aircraft of United AirLines Inc. in 2015- 2017. The share of direct costs amounted on average to 45%.In 2017 the financial results of United AirLines Inc. were affected mainly by the increase in the volumes of traffic and revenues. The revenues from passenger transportation increased by 1,180 billion dollars or by 4,1%, while the profitability of the seat- mile fell by 0,4%, due to lower profitability of regional flights. (According to the calculation, the average tariff for regional lines decreased from 150 to 138 dollars per one flight).
The cost of the seat-mile increased by 2,76%. The cost per seat-kilometer of long-haul aircraft operated by United AirLines Inc varies:
Table 25
The cost per seat-kilometer for AmericanAirIinesInc. (AAL), DeItaAirLines Inc. (DAL) and UnitedAirLines Inc. (UAL) on average in 2015-2017
Type of aircraft | Direct flight costs UAL AAL DAL | Indirect costs UAL AAL DAL | Total UAL AAL DAL | Average range, km UAL AAL DAL |
737-700 | 5,3 — 5,1 | 6,0 — 6,7 | 11,3 — 11,9 | 1873 — 1259 |
737-800 | 3,9 3,8 3,7 | 5,3 5,3 4,6 | 9,2 9,1 8,3 | 2122 1156 2240 |
737-900 | 3,1 — 3,0 | 5,2 — 4,8 | 8,3 — 7,7 | 2184 — 2126 |
747-400 | 4,0 — 3,0 | 3,5 — 3,1 | 7,5 — 6,1 | 9577 — 9629 |
757-200 | 3,9 3,9 3,6 | 4,4 4,7 5,0 | 8,2 8,6 8,6 | 3819 1712 2144 |
757-300 | 3,3 — 2,9 | 4,7 — 4,7 | 8,0 — 7,6 | 2949 — 2272 |
767-300 | 4,1 4,1 3,3 | 3,9 4,2 3,5 | 8,0 8,3 6,8 | 5826 2758 5341 |
76-400 | 3,2 — 3,1 | 3,7 — 3,3 | 6,9 — 6,4 | 6256 — 6604 |
777-200 | 3,7 4,6 3,1 | 3,7 3,9 3,1 | 7,4 8,4 6,2 | 7675 4515 10 430 |
777-300 | — 4,2 — | — 3,8 — | — 8,0 — | — 4793 |
787-800 | 3,4 3,8 — | 3,8 3,7 — | 7,2 7,5 — | 7057 5071 |
787-900 | 3,1 — — | 3,5 — — | 6,6 — — | 8919 — |
A319 | 4,8 3,9 5,7 | 7,3 6,4 6,5 | 12,1 10,3 12,2 | 1384 818 1289 |
A320 | 4,1 3,6 4,2 | 6,1 5,9 5,8 | 10,2 9,5 10,0 | 1701 946 1510 |
A321 | — 3,6 4,1 | — 5,2 8,8 | — 8,8 12,9 | — 1258 818 |
A330-200 | — 3,6 3,5 | — 4,0 3,1 | — 7,6 6,6 | — 3239 8815 |
A330-300 | — 3,5 2,8 | — 3,9 3,3 | — 7,5 6,0 | — 3411 6822 |
Grand total | 3,8 3,9 3,6 | 4,7 4,7 4,6 | 8,5 8,5 8,2 | 4718 2698 4510 |
Table 25
Estimated cost per seat-kilometer for UnitedAirLines, Inc. by type of aircraft in 2015-2017
Type of aircraft | Year |
Fuel consumption, g / seat-km | Wages of flight personnel | Jet fuel | Rent of aircraft | Other flight costs | Maintenance | Depreciation and amortization of flight equipment | Direct flight expenses | Airport expenses | Passenger sendees | Sales and reservations | Other production and administrative costs |
Total indirect costs |
|---|---|---|---|---|---|---|---|---|---|---|---|---|---|---|
737-700 | 2015 | 29,2 | 1,3 | 1,9 | 0,6 | 0,1 | 1,3 | 0,3 | 5,5 | 2,2 | 0,9 | 0,4 | 2,4 | 6,0 |
737-700 | 2016 | 29,4 | 1,4 | 1,4 | 0,6 | 0,1 | 1,2 | 0,3 | 5,1 | 2,3 | 0,9 | 0,5 | 2,4 | 6,0 |
737-700 | 2017 | 29,6 | 1,6 | 1,7 | 0,9 | 0,0 | 1,5 | 0,4 | 6,0 | 3,9 | 1,8 | 0,9 | 2,5 | 9,1 |
737-800 | 2015 | 24,0 | 0,9 | 1,5 | 0,4 | 0,1 | 0,8 | 0,3 | 4,0 | 1,7 | 0,8 | 0,4 | 2,4 | 5,3 |
737-800 | 2016 | 23,7 | 1,0 | 1,2 | 0,4 | 0,1 | 0,9 | 0,3 | 3,7 | 1,7 | 0,8 | 0,4 | 2,4 | 5,3 |
737-800 | 2017 | 23,4 | 1Д | 1,3 | 0,5 | 0,0 | 0,9 | 0,3 | 4,1 | 3,0 | 1,6 | 0,9 | 2,5 | 7,9 |
757-200 | 2015 | 27,8 | 0,8 | 1,8 | 0,1 | 0,1 | 0,9 | 0,4 | 4,0 | 1,3 | 0,4 | 0,2 | 2,4 | 4,4 |
757-200 | 2016 | 28,5 | 0,9 | 1,4 | 0,1 | 0,0 | 0,9 | 0,4 | 3,7 | 1,3 | 0,4 | 0,2 | 2,4 | 4,3 |
757-200 | 2017 | 28,7 | 1,0 | 1,6 | 0,1 | 0,0 | 1,3 | 0,4 | 4,4 | 2,2 | 0,9 | 0,5 | 2,5 | 6,1 |
757-300 | 2015 | 24,9 | 0,6 | 1,6 | 0,2 | 0,1 | 0,5 | 0,3 | 3,3 | 1,3 | 0,5 | 0,3 | 2,4 | 4,4 |
757-300 | 2016 | 25,7 | 0,7 | 1,2 | 0,0 | 0,1 | 0,9 | 0,4 | 3,3 | 1,6 | 0,6 | 0,3 | 2,4 | 4,9 |
757-300 | 2017 | 26,2 | 0,8 | 1,4 | 0,0 | 0,1 | 1,0 | 0,4 | 3,7 | 2,7 | 1,3 | 0,7 | 2,5 | 7,2 |
767-400 | 2015 | 27,6 | 0,7 | 1,7 | 0,1 | 0,0 | 0,5 | 0,3 | 3,3 | 0,9 | 0,2 | 0,1 | 2,4 | 3,7 |
767-400 | 2016 | 27,6 | 0,8 | 1,3 | 0,1 | 0,0 | 0,5 | 0,3 | 3,0 | 1,0 | 0,2 | 0,1 | 2,4 | 3,8 |
767-400 | 2017 | 27,3 | 0,9 | 1,5 | 0,1 | 0,0 | 1,0 | 0,4 | 3,9 | 1,8 | 0,5 | 0,3 | 2,5 | 5,0 |
767-300 | 2015 | 31,7 | 0,9 | 2,0 | 0,2 | 0,1 | 0,8 | 0,4 | 4,3 | 1,1 | 0,2 | 0,1 | 2,4 | 3,9 |
767-300 | 2016 | 31,4 | 1,0 | 1,5 | 0,1 | 0,0 | 0,8 | 0,4 | 3,8 | 1,1 | 0,3 | 0,1 | 2,4 | 3,9 |
767-300 | 2017 | 30,7 | 1,1 | 1,7 | 0,1 | 0,0 | 0,5 | 0,4 | 3,8 | 1,9 | 0,5 | 0,3 | 2,5 | 5,0 |
777-200 | 2015 | 30,0 | 0,7 | 1,9 | 0,1 | 0,1 | 0,8 | 0,4 | 4,0 | 0,9 | 0,2 | 0,1 | 2,4 | 3,7 |
777-200 | 2016 | 29,9 | 0,8 | 1,4 | 0,1 | 0,0 | 0,7 | 0,4 | 3,5 | 1,0 | 0,2 | 0,1 | 2,4 | 3,7 |
777-200 | 2017 | 29,5 | 0,8 | 1,6 | 0,1 | 0,0 | 0,8 | 0,5 | 3,9 | 1,7 | 0,5 | 0,2 | 2,5 | 4,9 |
737-900 | 2015 | 22,4 | 0,8 | 1,4 | 0,0 | 0,1 | 0,6 | 0,3 | 3,3 | 1,6 | 0,7 | 0,4 | 2,4 | 5,2 |
737-900 | 2016 | 22,5 | 0,9 | 1,1 | 0,0 | 0,1 | 0,6 | 0,3 | 3,0 | 1,6 | 0,8 | 0,4 | 2,4 | 5,2 |
737-900 | 2017 | 22,5 | 1,0 | 1,2 | 0,0 | 0,0 | 0,6 | 0,3 | 3,2 | 2,9 | 1,7 | 0,9 | 2,5 | 7,9 |
747-400 | 2015 | 33,3 | 0,6 | 2,1 | 0,1 | 0,1 | 0,7 | 0,6 | 4,2 | 0,8 | 0,2 | 0,1 | 2,4 | 3,5 |
747-400 | 2016 | 33,4 | 0,7 | 1,6 | 0,1 | 0,0 | 0,6 | 0,8 | 3,8 | 0,8 | 0,2 | 0,1 | 2,4 | 3,4 |
747-400 | 2017 | 33,7 | 0,7 | 1,8 | 0,1 | 0,0 | 0,8 | 1,1 | 4,6 | 1,4 | 0,3 | 0,2 | 2,5 | 4,3 |
787-800 | 2015 | 26,4 | 1,0 | 1,7 | 0,0 | 0,1 | 0,5 | 0,4 | 3,6 | 1,0 | 0,2 | 0,1 | 2,4 | 3,8 |
787-800 | 2016 | 26,7 | 1,1 | 1,3 | 0,0 | 0,0 | 0,4 | 0,4 | 3,2 | 1,1 | 0,2 | 0,1 | 2,4 | 3,8 |
787-800 | 2017 | 26,6 | 1,2 | 1,5 | 0,0 | 0,0 | 0,5 | 0,5 | 3,7 | 1,8 | 0,4 | 0,2 | 2,5 | 5,0 |
787-900 | 2015 | 24,9 | 0,9 | 1,5 | 0,0 | 0,1 | 0,3 | 0,5 | 3,3 | 0,8 | 0,2 | 0,1 | 2,4 | 3,6 |
787-900 | 2016 | 24,9 | 1,0 | 1,2 | 0,0 | 0,0 | 0,3 | 0,4 | 2,9 | 0,8 | 0,2 | 0,1 | 2,4 | 3,4 |
787-900 | 2017 | 24,9 | 1,1 | 1,4 | 0,0 | 0,0 | 0,5 | 0,4 | 3,4 | 1,2 | 0,3 | 0,2 | 2,5 | 4,2 |
A320 | 2015 | 25,6 | 1,0 | 1,6 | 0,3 | 0,1 | 0,8 | 0,3 | 4,1 | 2,1 | 0,9 | 0,5 | 2,4 | 5,9 |
A320 | 2016 | 25,9 | 1,2 | 1,2 | 0,3 | 0,1 | 1,0 | 0,3 | 4,1 | 2,3 | 1,0 | 0,5 | 2,4 | 6,2 |
A320 | 2017 | 25,9 | 1,3 | 1,4 | 0,3 | 0,1 | 1,4 | 0,3 | 4,8 | 3,8 | 2,0 | 1,1 | 2,5 | 9,4 |
A319 | 2015 | 29,3 | 1,2 | 1,8 | 0,1 | 0,1 | 1,0 | 0,5 | 4,8 | 2,9 | 1,1 | 0,6 | 2,4 | 7,1 |
A319 | 2016 | 29,3 | 1,4 | 1,4 | 0,1 | 0,1 | 1,3 | 0,6 | 4,9 | 3,2 | 1,3 | 0,7 | 2,4 | 7,5 |
A319 | 2017 | 29,3 | 1,6 | 1,6 | 0,1 | 0,1 | 1,7 | 0,6 | 5,7 | 5,4 | 2,5 | 1,3 | 2,5 | 11,6 |
*Wages, materials, spare parts.
Figure 4 shows the estimated cost of seat-kilometer depending on the range of passenger transportation by types of long-haul aircraft for American Airlines Inc., DeltaAirLines Inc. and UnitedAirLines Inc.
Table 25 shows the results of comparison of the cost of transportation by type of aircraft for American Airlines Inc., Delta AirLines Inc. and UnitedAirLines Inc. in 2015-2017. The cost per seat kilometer is compared separately for direct flight costs and indirect costs.
Delta AirLines Inc. has the lowest costs.
The operating result was influenced mainly by the reduction in the cost of jet fuel in 2014. The reduction in the cost of transportation in 2015-2016 was restrained by the growth of wage costs, costs associated with the acquisition of new aircraft and costs associated with reorganizations.
Since 2017 the cost of transportation has increased due to the rising costs of more expensive jet fuel and the maintenance of the aircraft fleet. The rates of payment for transportation capacities of regional operators, airport and rental payments, and other production costs have also increased.
The reduction of costs made it possible for US companies not to increase tariffs for passenger transportation in 2015- 2016. In 2017 the profitability of passenger transportation on domestic flights within the United States and Canada, as well as international flights to Europe and LatinAmerica, increased.
Compared to 2015 the cost of seat-kilometer decreased in 2016: for American Airlines Inc. - by 7,7%; DeltaAirLinesInc. - by 16,6%; UnitedAirLines Inc. - by 14,4%. The rate of revenues for seat kilometers also decreased, but the decline was 1,5-2,0 times smaller. As a result of the fact that revenues exceeded expenditures in the period from 2014 to 2016 the operating profits increased in comparison with the previous period.
In 2017 an increase in transportation costs was not offset by an increase in profitability, which led to the reduction in profitability compared with 2016.
The comparison of statistics of 2017 and 2016 showed that for American Airlines Inc. the cost of seat-km increased by 7%, the total profitability of seat-km increased by 4%, profitability decreased from 13,0 to 9,6%; for DeltaAirLinesInc. the cost of seat-km increased by 6%, the total profitability of seat-km increased by 2,6%, profitability decreased from 17,5 to 14,8%; for UnitedAirLines Inc., the cost of seat-kilometer increased by 2,76%, the total profitability of seat-km decreased by 0,28%, and profitability decreased from 11,9 to 9,3%.
1. 100- to 150-Seat Large Civil Aircraft from Canada (2018) // U.S. International Trade Commission. Publication 4759. URL: https://uschinatradewar.com/files/2018/02/ITC-Public-Opinion-Aircraft.pdf.
2. Ackert S. (2012), Basics of Aircraft Market Analysis, Aircraft Monitor // URL: https://www.iata.org/whatwedo/workgroups/Documents/Paperless%20Supply%20Chain/Basics-AC-MR.pdf.
3. American Airlines Group Inc. / United States Securities and Exchange Commission, Washington, D.C. 20549, Form 10-K: Annual report pursuant to section 13 or 15(d) of the securities exchange act of 1934/ For the Fiscal Year Ended December 31, 2017. (2018) // S. Securities and Exchange Commission. URL: https://www.sec.gov/Archives/edgar/data/4515/000000620118000009/a10k123117.htm
4. Bureau of Transportation Statistics ([s.a.]). URL: https://www.transtats.bts.gov.
5. Data Library: Aviation ([s.a.]) // Bureau of Transportation Statistics. URL: https://www.transtats.bts.gov/databases.asp?Mode_ID=1&Mode_Desc=Aviation&Subject_ID2=0.
6. Delta Air Lines, Inc. / United States Securities and Exchange Commission, Washington, D.C. 20549. Form 10-K: Annual report pursuant to section 13 or 15(d) of the securities exchange act of 1934, For the fiscal year ended December 31, 2017. (2018) // U.S. Securities and Exchange Commission. URL:
7. Dunn G. (2017) Analysis: Disruptions interrupt profitable 2017 for airlines // Flightglobal. URL: https://www.flightglobal.com/news/articles/analysis-disruptions-interrupt-profitable-2017-for-443686/.
8. Flight Fleets Analyzer. The world’s most comprehensive fleets database 2018 // Flightglobal. URL: https://dashboard.flightglobal.com/app/fleet/#/analyser/aircraft.
9. https://www.sec.gov/ix?doc=/Archives/edgar/data/27904/000002790418000006/dal1231201710k.htm.
10. Qiu Y. (2005) Can the 787 & A350 transform the economics of long-haul services? // Aircraft Commerce, Aircraft Analysis & Fleet Planning. N 39. P. 23–30. URL: http://www.aircraft-commerce.com/sample_articles/sample_articles/fleet_planning_sample.pdf.
11. Russell E. (2018) Analysis: Capacity between China and the USA is beginning to rationalise after years of accelerated growth // Flightglobal.URL: https://www.flightglobal.com/news/articles/analysis-airlines-rationalise-us-china-capacity-451406/.
12. Russell E. (2018) News airlines business strategy analysis: Let's hear it for Delta, 10-years after northwest // Flightglobal. URL: https://www.flightglobal.com/news/articles/analysis-lets-hear-it-for-delta-10-years-after-no-453041/.
13. Russell E. (2018) United growth plan shows no sign of letting up in 2019//Flightglobal. URL: https://www.flightglobal.com/news/articles/united-growth-plan-shows-no-sign-of-letting-up-in-20-452695/.
14. Statistical Air Transport Reporting Forms ([s.a.]) // ICAO. URL: https://www.icao.int/sustainability/pages/eap-sta-excel.aspx.
15. United / United States Securities and Exchange Commission, Washington, D.C. 20549. Form 10-K: Annual report pursuant to section 13 or 15(d) of the securities exchange act of 1934. For the Fiscal Year Ended December 31, 2017. (2018) // U.S. Securities and Exchange Commission. URL:https://www.sec.gov/Archives/edgar/data/100517/000119312518054235/d471340d10k.htm.
16.
Manvelidze A.B. OPERATING EXPENSES FOR LARGE AMERICAN AIR CARRIERS. Strategic decisions and risk management. 2018;(4):72-91. https://doi.org/10.17747/2078-8886-2018-4-72-91
Ligovsky av 73, of.401, Saint Petersburg, 190040, Russia
Tel.: +7 (812) 346-50-15 (16)
Real Economy Publishing House.
E-mail: info@jsdrm.ru
Registration certificate PI No. FS-77 - 72389 from 02.28.2018, issued by the Federal Service for Supervision in the Sphere of Communications, Information Technologies and Mass Communications.
Processing of personal data


