


Contents
Scroll to:
https://doi.org/10.17747/2078-8886-2018-1-88-101
Scroll to:
The article analyses passenger traffic distribution between air transport on domestic air routes and railway transport on the routes of large distances within the Russian Federation. The research objective is to define the air traffic increase potential especially on the distances up to 2500 km. City-pairs air passenger traffic and railway passenger traffic between the destination points statistics for 2014 and 2016, distances between the points of destination and actual economy class air fares and railway compartment carriage tariffs as well data on airports state in corresponding points of destination are used as original information.
Pivot tables of traffic on 5 thousand routes by both modes of transport are drawn up.
Specific traffic shares by air transport between points of origin (taking off) and destination (landing) are defined. Passenger traffic distribution is evaluated by distance intervals in Russian Federation as a whole and from major airports : Moscow, Ekaterinburg, Sochi and Simferopol. The analysis defines the trend of traffic share increase by air transport along with rising traffic distances.
The research reveals that 94,2% of passenger traffic by rail and 83% of traffic by air are carried for the distances up to 2 500 km.
The statistics example of passenger traffic from Moscow and Ekaterinburg demonstrates that regional routes with distances up to 1000 km are the main increase potential for the traffic growth. In 2016 traffic share by air transport for the distances interval up to 1000 km was 16%.
According to the tariffs analysis the conclusion is made that air fares exceed rail tariffs on flight distances up to 1000 km (because of the short distances flight speculiarities) and on the routes to hard-to-reach and remote areas. Passengers choice in favor of air transport on regional routes depends on creation of economic conditions to attract more passengers.
Manvelidze A.B. Comparison analysis of passenger traffic by air and rail transport. Strategic decisions and risk management. 2018;(1):88-101. https://doi.org/10.17747/2078-8886-2018-1-88-101
From 1991 to 2000 air transportation of domestic air lines decreased from 84,6 million passengers to 13,4 million passengers, or more than 6 times. Since 2001 the transportation was increasing annually with the exception of the crisis year 2009. By 2016 the transportation by domestic air lines increased to 56,4 million passengers, which was 66,6% of the 1991 level.
The transportation from major cities to Moscow, St. Petersburg, Sochi, Yekaterinburg, Kaliningrad and Simferopol was restored at high rates. A significant contribution to the growth of air traffic (more than 2 million annually) was made by shift transportation.
The lowest rates of restoration of regional destinations are observed in the Central, North-Western, Ural, Southern and North-Caucasian federal districts.
The growth of traffic in the Volga Federal District was somewhat accelerated after the introduction of targeted subsidies for regional flights.
At the same time, the main potential for the growth of air transportation is concentrated in these densely populated federal districts with more than 80% of the population, the concentration of production, financial, scientific and recreational resources of the country. It should be noted that air transport is not represented in internal tourism, for example, on the routes of the "Golden Ring" and the "Silver Ring".
To develop the concept of development of regional aviation in the Russian Federation, it is important to have data on the general mobility of the population and on the competition of modes of transportation according to destinations. For this purpose the study compares the volumes of passenger traffic by competing modes of transport - by air (domestic air lines) and rail (longdistance traffic) within Russia.
For this study we used the statistics of passenger traffic between city pairs in air transport and between
По данным за 2014 и 2016 годы, pacnpeflendestinations in railway transport for 2014 and 2016 determining the distances between destinations and analyzing the current tariffs. We also conducted the distribution of passenger transportation for the entire array of available information determining the ratios of transportation by competing modes for the routes with different distances as well as the trends of changes in tariffs according to the modes and ranges of transportation.
The aim of the study is to identify the potential for increasing air transport by destinations.
In 2016 56,4 million passengers were transported by air and 102,6 million passengers by railway. Compared to 2014, air transportation increased by 22%, and railway transportation - by 6%. In the total volume of passenger transportation by these two types of transport - aviation and railway, in the long-distance transportation the share of air transport was 35%, that is 3% higher than in 2014.
According to the data for 2014 and 2016, the distribution of passenger traffic by air and railway in terms of distances in Russia in general and individual cities (Moscow, Ekaterinburg, Sochi and Simferopol) is presented in Table. I. Regarding the transportation by air and railway transport, there is a trend towards changing in the share of air transport by the distance of transportation in Russia (figure 1).
The main potential for increasing air transportation is regional transportation for distances up to 1000 km. To determine the specific directions of transportation, the transportation from Moscow, Yekaterinburg and Sochi was analyzed. For this purpose similar groups of traffic directions are identified. The comparison of passenger tariffs of aviation and railway transport for the same destinations was also made. Within a year the ratio between the transportation by two modes of transport varies: air transportation is to a lesser degree subject to seasonal fluctuations, and in the summer months their share of traffic decreases (Figure 2).
Fig. 1. The trend of changes in the share of air transportation according to the intervals in the distance of transportation
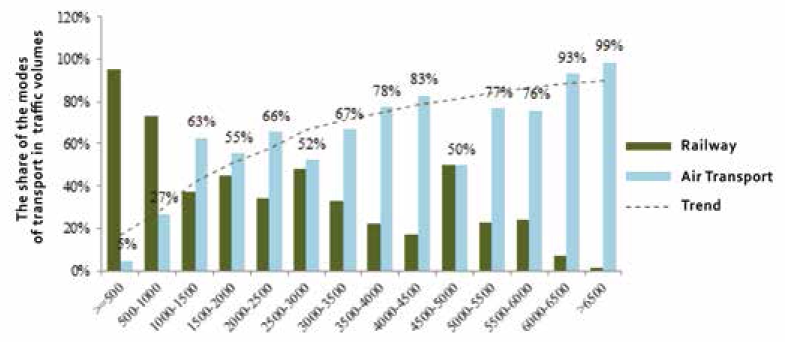
Fig. 2. The comparison of the volumes of passenger transportation by railway (a) and air (b) transport by months in 2016
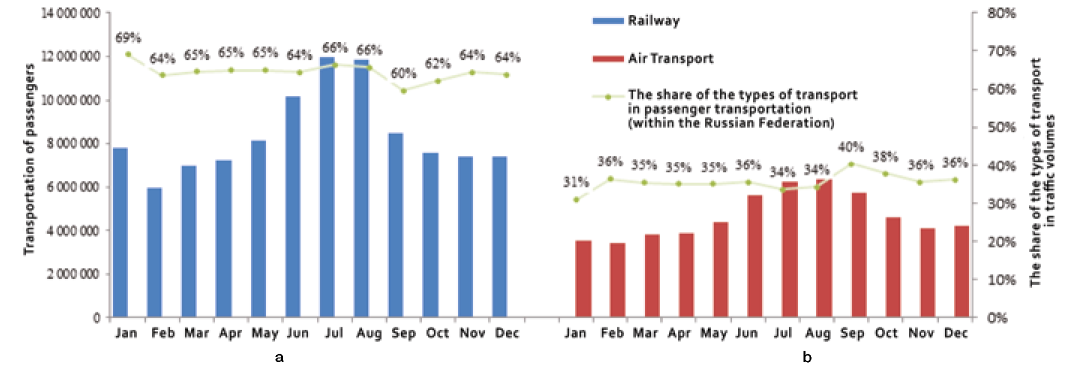
Table 1
Distribution of passenger transportation by distance
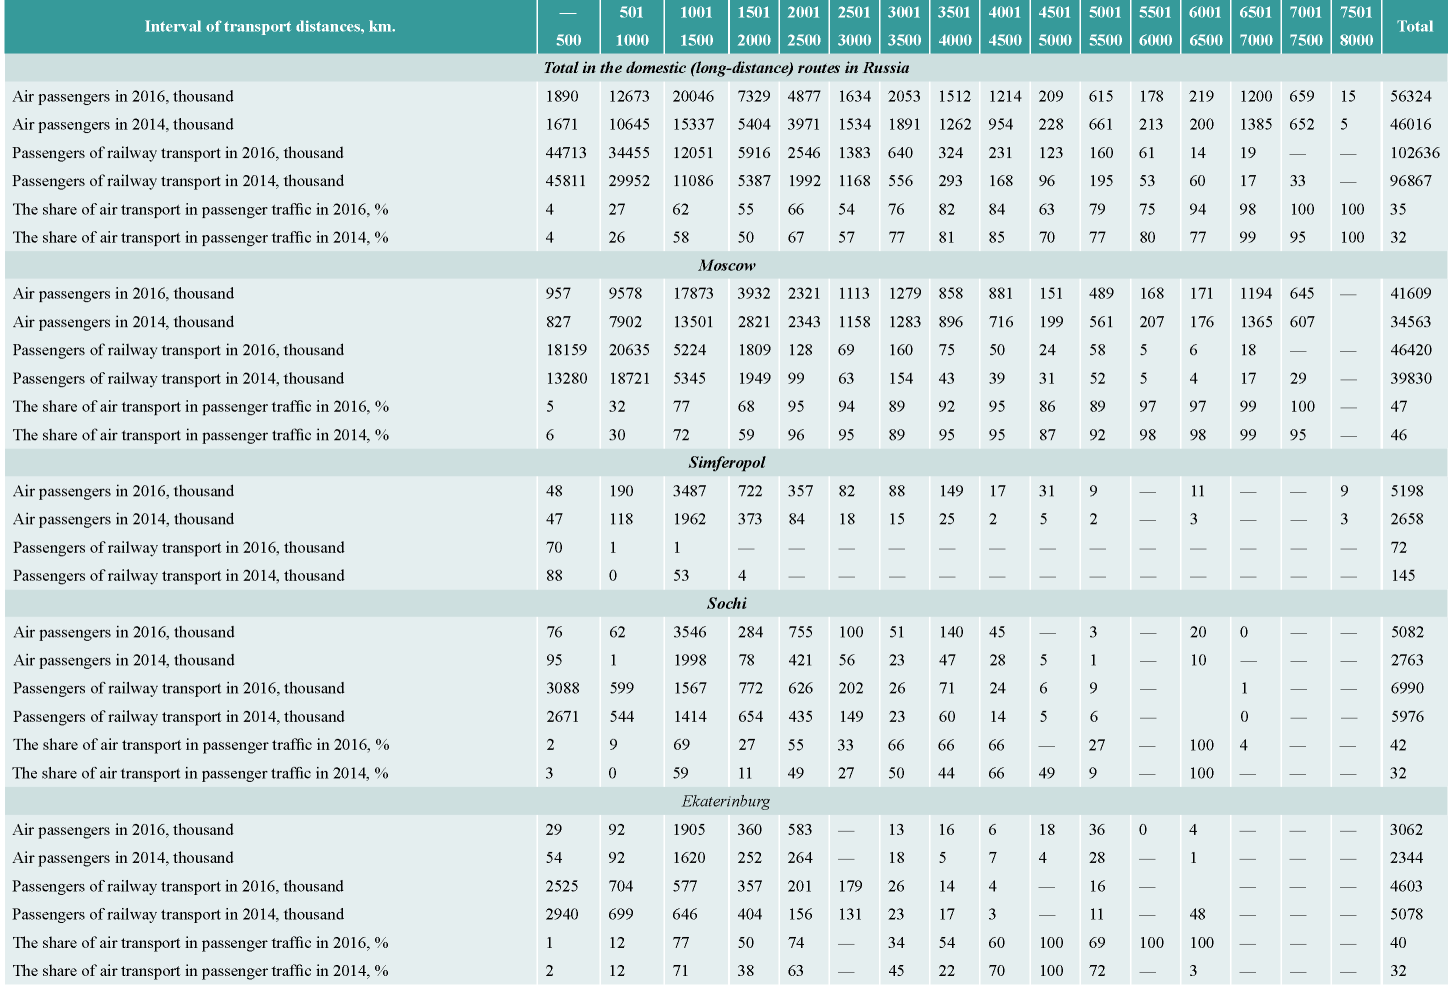
Table 2
Transportation on the largest routes of air travel to Moscow (round trip) in 2014-2016, thousand people.
|
Aiport of departure |
Airport of destination |
Distance interval, km. |
2016 |
2014 |
The share of air transportation, % |
|||
|---|---|---|---|---|---|---|---|---|
|
Railway transport |
Air transport |
ailway transport |
Air transport |
2016 |
2014 |
|||
|
Moscow |
Voronezh |
up to 500 |
1098 |
332 |
1054 |
254 |
23 |
19 |
|
Moscow |
Cheboksary |
501-1000 |
634 |
147 |
663 |
39 |
19 |
5 |
|
Moscow |
Belgorod |
501-1000 |
916 |
251 |
742 |
163 |
21 |
18 |
|
Moscow |
St. Petersbwg |
501-1000 |
8930 |
3817 |
6848 |
3378 |
30 |
33 |
|
Moscow |
Kazan |
501-1000 |
1162 |
992 |
1180 |
762 |
46 |
39 |
|
Moscow |
Kirov |
501-1000 |
578 |
122 |
653 |
42 |
17 |
6 |
|
Moscow |
Samara |
501-1000 |
800 |
1193 |
880 |
962 |
60 |
52 |
|
Moscow |
Volgograd |
501-1000 |
405 |
692 |
427 |
489 |
63 |
53 |
|
Moscow |
Rostov-on-Don |
501-1000 |
439 |
1375 |
514 |
1167 |
76 |
69 |
|
Moscow |
Ufa |
1001-1500 |
166 |
1103 |
197 |
940 |
87 |
83 |
|
Moscow |
Penn |
1001-1500 |
287 |
779 |
331 |
668 |
73 |
67 |
|
Moscow |
Kaliningrad |
1001-1500 |
246 |
1115 |
226 |
854 |
82 |
79 |
|
Moscow |
Krasnodar |
1001-1500 |
257 |
1934 |
271 |
1830 |
88 |
87 |
|
Moscow |
Anapa + Novorossiysk |
1001-1500 |
986 |
953 |
896 |
649 |
51 |
41 |
|
Moscow |
Simferopol |
1001-1500 |
1 |
3381 |
53 |
1933 |
100 |
97 |
|
Moscow |
Astraklian |
1001-1500 |
122 |
446 |
169 |
316 |
79 |
65 |
|
Moscow |
Mineralnye Vody |
1001-1500 |
387 |
1292 |
375 |
1225 |
77 |
77 |
|
Moscow |
Sochi |
1001-1500 |
731 |
3433 |
682 |
1958 |
82 |
74 |
|
Moscow |
Ekaterinburg |
1001-1500 |
247 |
1697 |
293 |
1468 |
87 |
83 |
|
Moscow |
Nalchik |
1501-2000 |
- |
161 |
- |
67 |
100 |
100 |
|
Moscow |
Vladikavkaz |
1501-2000 |
166 |
355 |
219 |
179 |
68 |
45 |
|
Moscow |
Nazran |
1501-2000 |
0 |
192 |
0 |
84 |
100 |
100 |
|
Moscow |
Chelyabinsk |
1501-2000 |
97 |
889 |
102 |
796 |
90 |
89 |
|
Moscow |
Munnansk |
1501-2000 |
323 |
441 |
400 |
314 |
58 |
44 |
|
Moscow |
Makhachkala |
1501-2000 |
125 |
728 |
204 |
360 |
85 |
64 |
|
Moscow |
Tyumen |
1501-2000 |
185 |
714 |
252 |
509 |
79 |
67 |
|
Moscow |
Surgut |
2001-2500 |
- |
560 |
- |
436 |
100 |
100 |
|
Moscow |
Sabetta |
4001-4500 |
- |
139 |
- |
- |
100 |
- |
|
Moscow |
Voronezh |
up to 500 |
1098 |
332 |
1054 |
254 |
23 |
19 |
|
Total |
19288 |
29234 |
17631 |
21841 |
60 |
55 |
||
In 2016 41,1 million passengers were transported by air from Moscow. Compared to 2014, in 2016 air traffic from Moscow increased by 19 %. 46.4 million passengers were transported by rail, or 17% more than in 2014. In the overall transportation of two modes of transport the share of air transportation increased from 46% in 2014 to 47% in 2016.
Air and railway destinations from Moscow were analyzed: 194 in 2016 and 192 in 2014. The transportation by two modes of transport was carried out in 72 directions in 2016 and 69 in 2014.
Air transportation was not carried out in 56 directions in 2016 and 64 in 2014 while one half of them are directions with a length of less than 1000 km from large railway junctions: Ryazan, Ruzaevka, Orel, Bologoye, Vyazma, Murom, Unecha and others. The railway passenger transportation was not carried out to Surgut, Novy Urengoy, Nizhnevartovsk, Yuzhno-Sakhalinsk, Petropavlovsk-Kamchatsky, Nizhnekamsk, Yakutsk, Norilsk and other remote cities in 66 directions in 2016 and 59 in 2014.
More than 70% of all air traffic by Russian companies is carried out on domestic air routes and 45% of passenger transportation by railway on long-distance routes from Moscow.
In terms of traffic volumes and the share of air transport in transportation from Moscow we have identified the following groups:
Table 3
Air transportation to Moscow (round trip) on distant routes, thousand people
|
Point of destination |
Interval of distances, km |
Absolute number |
Share, % |
Dynamics of 10 months |
||||
|---|---|---|---|---|---|---|---|---|
|
2014 |
2016 |
2014 |
2016 |
2014 |
2016 |
2017 |
||
|
Omsk |
2001-2500 |
618 |
541 |
88 |
82 |
173 |
143 |
163 |
|
Novosibirsk |
2501-3000 |
1158 |
1113 |
95 |
94 |
570 |
486 |
523 |
|
Kemerovo |
3001-3500 |
214 |
174 |
91 |
89 |
182 |
146 |
202 |
|
Krasnoyarsk |
3501^1000 |
743 |
712 |
95 |
94 |
634 |
591 |
726 |
|
Ulan-Ude |
4501-5000 |
197 |
151 |
91 |
93 |
967 |
939 |
954 |
|
Chita |
5001-5500 |
210 |
171 |
94 |
91 |
521 |
457 |
483 |
|
Blagoveshchensk |
5501-6000 |
207 |
168 |
100 |
100 |
172 |
133 |
139 |
|
Kliabarovsk |
6501-7000 |
624 |
567 |
98 |
98 |
537 |
491 |
525 |
|
Vladivostok |
6501-7000 |
669 |
575 |
99 |
99 |
181 |
151 |
156 |
|
Total |
|
4640 |
4172 |
95 |
93 |
3937 |
3537 |
3871 |
Table 4
Directions of passenger transportation to Moscow (round trip) with railway transport, thousand people
|
Point of destination |
Interval, km |
2016 |
2014 |
The share of air transportation, % |
|||
|---|---|---|---|---|---|---|---|
|
Railway transport |
Air transport |
Railway transport |
Air transport |
2016 |
2014 |
||
|
Belgorod |
501-1000 |
916 |
251 |
742 |
163 |
21 |
18 |
|
Bryansk |
up to 500 |
1295 |
0,1 |
1055 |
0,3 |
0,005 |
0,033 |
|
Vladimir |
up to 500 |
956 |
0,0 |
425 |
0,004 |
0,0 |
0,0 |
|
Voronezh |
501-1000 |
1098 |
332 |
1054 |
254 |
23 |
19 |
|
Kazan |
501-1000 |
1162 |
992 |
1180 |
762 |
46 |
39 |
|
Kursk |
501-1000 |
843 |
23 |
832 |
22 |
3 |
3 |
|
Nizlmiy Novgorod |
up to 500 |
2203 |
464 |
2088 |
443 |
17 |
18 |
|
Penza + Ruzayevka |
501-1000 |
1605 |
71 |
1673 |
51 |
4 |
3 |
|
Ryazan |
up to 500 |
1248 |
- |
254 |
0,0 |
0 |
0 |
|
Samara |
501-1000 |
800 |
1193 |
880 |
962 |
60 |
52 |
|
Saratov |
501-1000 |
1108 |
341 |
1099 |
341 |
24 |
24 |
|
Yaroslavl |
up to 500 |
1351 |
0,4 |
1244 |
1 |
0,03 |
0,10 |
|
Total |
— |
14584 |
3667 |
12524 |
3000 |
20 |
19 |
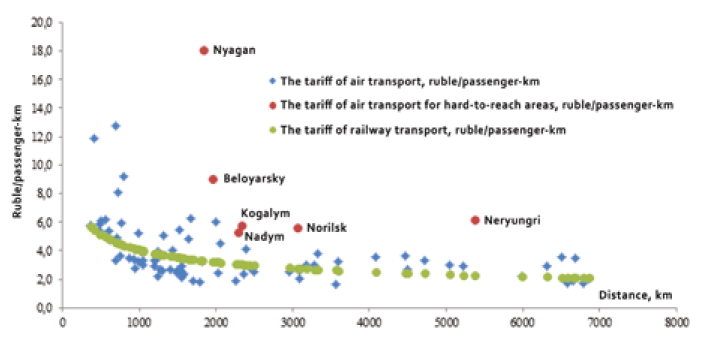
The comparative data on tariffs of air and railway transport are shown in Fig. 3. For the railway transport tariffs for compartments are considered.
Aviation tariffs are 2 times liigher than the average trend on those routes where there is no railway connection.
Aviation tariffs are also higher on those routes where the range of flight is less than 1000 km, which is caused by high fees of airports and air navigation services needed for non-stop flights. On the remaining routes tariff rates for the air and railway transport are in the same price range.
Fig. 3. Tariff rates on the routes to Moscow and from Moscow. The comparison of air and railway fares (a travel in compartment)
In 2016 3,062 million passengers were transported from Ekaterinburg (+ 31% compared with 2014) by air transport and 4,603 million (- 9% compared with 2014) by railway long-distance transport. In the general transportation of passengers the share of air transport increased from 32% in 2014 to 35% in 2016.
In terms of traffic volumes and the share of air transport in transportation from Ekaterinburg we have identified the following groups:
Table 5
The calculation of the growth of air transportation with an increase in the share of air transport, thousand people.
|
Point of destination |
Assumption |
Growth of air transport |
Tariffs for air transportation |
Tariffs for railway transportation |
||||
|---|---|---|---|---|---|---|---|---|
|
Share, |
Air |
seat |
economy |
compart |
Speed trains |
|||
|
Belgorod |
33 |
389 |
138 |
From 2400 to 3200 |
1007 |
1438 |
3515 |
— |
|
Bryansk |
33 |
432 |
432 |
From 1000 to 2000 |
856 |
1000 |
2204 |
— |
|
Vladimir |
33 |
319 |
319 |
From 1000 to 1500 |
1267 |
2450 |
4711 |
1127 |
|
Voronezh |
33 |
477 |
145 |
From 2400 to 2800 |
— |
873 |
2979 |
1272 |
|
Kazan |
50 |
1077 |
85 |
From 1300 to 2300 |
— |
960 |
2387 |
— |
|
Kursk |
33 |
289 |
265 |
From 2500 to 3100 |
1355 |
1128 |
2303 |
1192 |
|
Nizlmiy Novgorod |
33 |
889 |
425 |
From 1700 to 1900 |
— |
1715 |
3012 |
1211 |
|
Penza + Ruzayevka |
33 |
559 |
488 |
From 2800 to 3050 |
990 |
960 |
2396 |
— |
|
Ryazan |
33 |
416 |
416 |
From 1000 to 1500 |
— |
579 |
2062 |
— |
|
Samara |
70 |
1395 |
202 |
From 1900 to 2300 |
— |
1293 |
3295 |
1211 |
|
Saratov |
33 |
483 |
142 |
From 4100 to 5200 |
1063 |
1048 |
2637 |
— |
|
Yaroslavl |
33 |
450 |
450 |
From 7500 to 7500 |
580 |
1565 |
— |
— |
|
Total |
39 |
7174 |
3507 |
|
|
|
|
|
Fig. 4. Tariff rates on the routes to Ekaterinburg and from Ekaterinburg. The comparison of air and railway tariffs (in compartment cars)
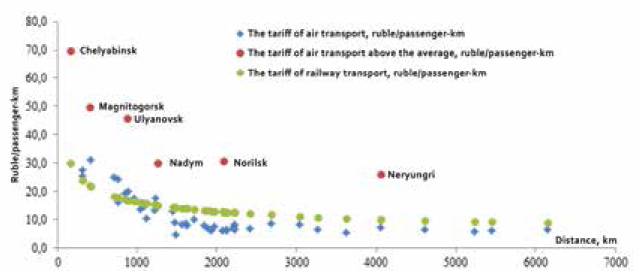
The comparative data on tariffs of air and railway transport from Ekaterinburg are shown in Fig. 4 showing the fares of above average level to hard-to-reach airports as well as the closest airports: Chelyabinsk, Magnitogorsk and Ulyanovsk.
In 2016 5,082 million passengers were transported to and from Sochi by air (the growth of 1,8 times compared to 2014) and by railway - about 7 million passengers (the growth of 17%).
The share of air transportation in the general passenger traffic increased from 32% in 2014 to 42% in 2016. The transportation of passengers on the route Moscow - Sochi and in the opposite direction makes up 67,5% of the total volume of air transportation. The growth of air transportation to Sochi after 2014 is explained by the closure of charter flights to Egypt and Turkey. In total, air transportation to and from Sochi was carried out in 70 directions.
For 8 directions in 10 months of 2017 the growth of traffic to Sochi was on average 4% compared to the same period in 2016 including the route Moscow - Sochi with an increase in air transportation by 1%.
Table 6
The share of air transportation on the Iargestairtraffic routes from Ekaterinburg (round trip) in 2014-2016, thousand people.
|
Airport of departure |
Airport of destination |
Interval of distance, |
2016 |
2014 |
The share of air transportation, % |
|||
|---|---|---|---|---|---|---|---|---|
|
Railway transport |
Air transport |
Railway transport |
Air transport |
2016 |
2014 |
|||
|
Ekaterinburg |
Ufa |
Up to 500 |
48 |
16 |
67 |
16 |
25 |
19 |
|
Ekaterinburg |
Moscow |
1001-1500 |
247 |
1697 |
293 |
1468 |
87 |
83 |
|
Ekaterinburg |
Novosibirsk |
1001-1500 |
81 |
109 |
89 |
49 |
57 |
36 |
|
Ekaterinburg |
Samara |
1001-1500 |
49 |
37 |
58 |
18 |
43 |
24 |
|
Ekaterinburg |
Nizlmy Novgorod |
1001-1500 |
42 |
5 |
47 |
16 |
11 |
25 |
|
Ekaterinburg |
Volgograd |
1501-2000 |
26 |
7 |
27 |
0 |
21 |
I |
|
Ekaterinburg |
St. Petersburg |
1501-2000 |
135 |
291 |
158 |
203 |
68 |
56 |
|
Ekaterinburg |
Mineralnye Vody |
1501-2000 |
25 |
20 |
27 |
33 |
45 |
55 |
|
Ekaterinburg |
Tomsk |
1501-2000 |
15 |
6 |
18 |
I |
30 |
4 |
|
Ekaterinburg |
Voronezh |
1501-2000 |
11 |
6 |
15 |
— |
37 |
— |
|
Ekaterinburg |
Rostov-on-Don |
1501-2000 |
20 |
18 |
28 |
13 |
47 |
31 |
|
Ekaterinburg |
Simferopol |
2001-2500 |
|
172 |
0,6 |
43 |
100 |
99 |
|
Ekaterinburg |
Sochi |
2001-2500 |
110 |
251 |
72 |
89 |
70 |
55 |
|
Ekaterinburg |
Anapa + Novorossiysk |
2001-2500 |
153 |
71 |
119 |
35 |
32 |
23 |
|
Ekaterinburg |
Krasnodar |
2001-2500 |
36 |
33 |
29 |
48 |
48 |
62 |
|
Ekaterinburg |
Krasnoyarsk |
2001-2500 |
30 |
27 |
31 |
21 |
47 |
40 |
|
Ekaterinburg |
Irkutsk |
3001-3500 |
19 |
10 |
17 |
13 |
34 |
44 |
|
Ekaterinburg |
Chita |
3501M000 |
10 |
16 |
13 |
5 |
62 |
27 |
|
Ekaterinburg |
Vladivostok |
5001-5500 |
4 |
19 |
3 |
13 |
83 |
83 |
|
Ekaterinburg |
Kliabarovsk |
5001-5500 |
8 |
17 |
5 |
15 |
69 |
75 |
|
Total |
|
|
1069 |
2827 |
1117 |
2097 |
73 |
65 |
Table 7
Air transportation from Ekaterinburg (round trip) on different routes, passengers.
| Airport of departure |
Airport of destination |
Interval of distance, km |
Air transport | The share of air transportation, % |
||
|---|---|---|---|---|---|---|
|
2016 |
2014 |
2016 |
2014 |
|||
|
Ekaterinburg |
Beloretsk |
Up to 500 |
|
|
100 |
|
|
Ekaterinburg |
Sovyetskiy |
Up to 500 |
5297 |
6979 |
100 |
100 |
|
Ekaterinburg |
Urai |
Up to 500 |
3414 |
6630 |
100 |
100 |
|
Ekaterinburg |
Beloymsky |
501-1000 |
9126 |
9815 |
100 |
100 |
|
Ekaterinburg |
Nizlmekamsk |
501-1000 |
983 |
2080 |
100 |
100 |
|
Ekaterinburg |
Surgut |
501-1000 |
31548 |
31328 |
100 |
100 |
|
Ekaterinburg |
Syktyvkar |
501-1000 |
10135 |
5231 |
100 |
100 |
|
Ekaterinburg |
Klianty-Mansiysk |
501-1000 |
10011 |
15877 |
100 |
100 |
|
Ekaterinburg |
Varandey |
1001-1500 |
11 |
— |
100 |
— |
|
Ekaterinburg |
Nadym |
1001-1500 |
9754 |
11182 |
100 |
100 |
|
Ekaterinburg |
Nizlmevartovsk |
1001-1500 |
8842 |
7511 |
100 |
100 |
|
Ekaterinburg |
Novy Urengoy |
1001-1500 |
15399 |
7191 |
100 |
100 |
|
Ekaterinburg |
Noyabrsk |
1001-1500 |
8913 |
8218 |
100 |
100 |
|
Ekaterinburg |
Salekliard |
1001-1500 |
13409 |
16231 |
100 |
100 |
|
Ekaterinburg |
Saransk |
1001-1500 |
64 |
112 |
100 |
100 |
|
Ekaterinburg |
Usinsk |
1001-1500 |
7 |
— |
100 |
— |
|
Ekaterinburg |
Cherepovets |
1001-1500 |
209 |
243 |
100 |
100 |
|
Ekaterinburg |
Belgorod |
1501-2000 |
6264 |
62 |
100 |
100 |
|
Ekaterinburg |
Gorno-Altaisk |
1501-2000 |
668 |
— |
100 |
— |
|
Ekaterinburg |
Kogalym |
1501-2000 |
6 |
441 |
100 |
100 |
|
Ekaterinburg |
Kursk |
1501-2000 |
99 |
132 |
100 |
100 |
|
Ekaterinburg |
Petrozavodsk |
1501-2000 |
3 |
63 |
100 |
100 |
|
Ekaterinburg |
Ramenskoye |
1501-2000 |
45 |
— |
100 |
— |
|
Ekaterinburg |
Ymnburg |
1501-2000 |
1637 |
1092 |
100 |
100 |
|
Ekaterinburg |
Gelendzliik |
2001-2500 |
16737 |
14031 |
100 |
100 |
|
Ekaterinburg |
Murmansk |
2001-2500 |
79 |
— |
100 |
— |
|
Ekaterinbmg |
Norilsk |
2001-2500 |
12625 |
14155 |
100 |
100 |
|
Ekaterinbmg |
Sabetta |
2001-2500 |
7 |
— |
100 |
— |
|
Ekaterinbmg |
Bratsk |
2501-3000 |
22 |
— |
100 |
— |
|
Ekaterinbmg |
Dikson |
2501-3000 |
20 |
— |
100 |
— |
|
Ekaterinbmg |
Mirny |
3001-3500 |
3165 |
3860 |
100 |
100 |
|
Ekaterinbmg |
Neryungri |
4001M500 |
7 |
1858 |
100 |
100 |
|
Ekaterinbmg |
Yakutsk |
4001M500 |
5748 |
5048 |
100 |
100 |
|
Ekaterinbmg |
Blagoveshchensk |
4501-5000 |
18458 |
3748 |
100 |
100 |
|
Ekaterinbmg |
Yuzlmo-Saklialinsk |
5501-6000 |
296 |
— |
100 |
— |
|
Ekaterinbmg |
P.-Kamchatsky |
6001-6500 |
3845 |
1283 |
100 |
3 |
|
Total |
— |
— |
197051 |
174401 |
100 |
79 |
Table 8
with the advantages of railway transport, thousand passengers
|
Point of destination |
Interval of distance, km |
2016 |
2014 |
The share of air transportation, % |
|||
|---|---|---|---|---|---|---|---|
|
Railway transport |
Air transport |
Railway transport |
Air transport |
2016 |
2014 |
||
|
Tymen |
Up to 500 |
853 |
4,9 |
1040 |
11,6 |
0,57 |
1,10 |
|
Serov |
Up to 500 |
392 |
— |
408 |
— |
— |
— |
|
Penn |
Up to 500 |
365 |
2,4 |
461 |
0,6 |
0,64 |
0,12 |
|
Izhevsk |
Up to 500 |
203 |
0,9 |
209 |
7,6 |
0,43 |
3,52 |
|
Kurgan |
Up to 500 |
193 |
0,0 |
217 |
4,3 |
0,02 |
1,95 |
|
Tavda |
Up to 500 |
144 |
— |
148 |
|
|
|
|
Magnitogorsk |
Up to 500 |
21 |
0,7 |
19 |
6,8 |
3,09 |
26,79 |
|
Chusovskaya |
Up to 500 |
15 |
— |
23 |
— |
— |
— |
|
Zlatoust |
Up to 500 |
9 |
— |
11 |
— |
— |
— |
|
Kazan |
501-1000 |
195 |
12,1 |
153 |
1,3 |
5,81 |
0,84 |
|
Omsk |
501-1000 |
137 |
7,2 |
134 |
2,5 |
4,97 |
1,85 |
|
Orenburg |
501-1000 |
86 |
5,4 |
96 |
7,0 |
5,88 |
6,83 |
|
Kirov |
501-1000 |
85 |
0,0 |
94 |
0,1 |
0,01 |
0,09 |
|
Orsk |
501-1000 |
84 |
0,1 |
102 |
0,3 |
0,08 |
0,33 |
|
Solikamsk |
501-1000 |
37 |
— |
40 |
— |
— |
— |
|
Zuyevka |
501-1000 |
31 |
— |
32 |
— |
— |
— |
|
Ulyanovsk |
501-1000 |
23 |
0,1 |
20 |
4,7 |
0,27 |
19,00 |
|
Sharya |
501-1000 |
9 |
— |
10 |
— |
— |
— |
|
Alatyr |
501-1000 |
6 |
— |
6 |
— |
— |
— |
|
Saratov |
1001-1500 |
33 |
I |
32 |
18 |
1,68 |
35,77 |
|
Cheboksary |
1001-1500 |
25 |
— |
28 |
— |
— |
— |
|
Vologda |
1001-1500 |
19 |
0,0 |
17 |
— |
0,24 |
— |
|
Penza |
1001-1500 |
25 |
— |
25 |
— |
— |
— |
|
Sizran |
1001-1500 |
9 |
— |
9 |
— |
— |
— |
|
Kostroma |
1001-1500 |
8 |
— |
9 |
0,2 |
— |
2,61 |
|
Yoshkar-Ola |
1001-1500 |
6 |
— |
6 |
|
— |
|
|
Barnaul |
1501-2000 |
30 |
— |
33 |
0,4 |
— |
1,32 |
|
Novokuznetsk |
1501-2000 |
15 |
0,1 |
16 |
0,1 |
0,40 |
0,88 |
|
Kemerovo |
1501-2000 |
15 |
0,2 |
17 |
0,7 |
1,22 |
3,85 |
|
Makhachkala |
1501-2000 |
14 |
0,1 |
13 |
0,1 |
0,94 |
0,96 |
|
Vladimir |
1501-2000 |
11 |
— |
12 |
— |
— |
— |
|
Starominskaya |
1501-2000 |
11 |
— |
2 |
— |
— |
— |
|
Arzamas |
1501-2000 |
8 |
— |
8 |
— |
— |
— |
|
Stary Oskol |
1501-2000 |
|
— |
4 |
— |
— |
— |
|
Annavir |
2001-2500 |
9 |
— |
10 |
— |
— |
— |
|
Astraklian |
2001-2500 |
5 |
— |
5 |
0,0 |
— |
0,22 |
|
Nizlmeudinsk |
2001-2500 |
5 |
— |
4 |
— |
— |
— |
|
Abakan |
2501-3000 |
15 |
— |
2 |
— |
— |
— |
|
Lena |
2501-3000 |
11 |
— |
10 |
— |
— |
— |
|
Ulan-Ude |
3001-3500 |
6 |
0,003 |
6 |
1,5 |
0,05 |
19,93 |
|
Tynda |
3501—4000 |
2 |
— |
2 |
— |
— |
— |
|
Ussuriysk |
5001-5500 |
5 |
— |
3 |
— |
— |
— |
|
Total |
|
3175 |
35 |
3495 |
68 |
1,1 |
1,9 |
Table 9
Air transportation from Ekaterinburg (round trip) on the main routes, passengers
| Point of destination |
Interval of distance, km |
Air transport | Share in total passenger traffic |
Air transportation in 10 months of 2017 | |||||||
|---|---|---|---|---|---|---|---|---|---|---|---|
|
2014 |
2016 |
growth: |
2014 |
2016 |
Dynamics | Growth | |||||
|
2014 |
2016 |
2017 |
2016 |
2017 |
|||||||
|
Krasnodar |
До 500 |
92,1 |
62,1 |
68 |
5 |
8 |
75 |
48 |
63 |
64 |
130 |
|
Samara |
1001-1500 |
24,9 |
78,6 |
316 |
33 |
17 |
25 |
76 |
74 |
309 |
98 |
|
Moscow |
1001-1500 |
1957,6 |
3433,4 |
175 |
82 |
74 |
1732 |
3087 |
3121 |
178 |
101 |
|
Kazan |
1501-2000 |
28,5 |
87,2 |
306 |
48 |
28 |
641 |
86 |
79 |
13 |
92 |
|
Ufa |
1501-2000 |
19,2 |
78,3 |
407 |
51 |
26 |
19 |
78 |
66 |
417 |
85 |
|
St. Petersburg |
2001-2500 |
283,8 |
407,1 |
143 |
62 |
63 |
258 |
363 |
467 |
141 |
128 |
|
Ekaterinburg |
2001-2500 |
88,5 |
251,3 |
284 |
70 |
55 |
83 |
236 |
245 |
286 |
104 |
|
Novosibirsk |
3501M000 |
32,3 |
129,9 |
402 |
78 |
51 |
30 |
125 |
151 |
418 |
121 |
|
Total |
|
2527 |
4528 |
179 |
62 |
53 |
2862 |
4099 |
4266 |
143 |
104 |
Table 10
Railwaytransportation to and from Sochi on the main routes in 2016
|
Point of destination |
Passengers, thousand |
Point of destination |
Passengers, thousand |
|---|---|---|---|
|
Krasnodar |
1263,9 |
Samara |
158,8 |
|
Moscow |
730,9 |
Vladikavkaz |
110,9 |
|
Rostov-on-Don |
669,4 |
Ekaterinburg |
110,2 |
|
Annavir |
442,9 |
Nizlmy Novgorod |
100,5 |
|
Mineralny Vody |
306,9 |
Kazan |
95,0 |
|
Voronezh |
274,7 |
Penn |
87,4 |
|
St. Petersburg |
249,7 |
Chelyabinsk |
77,0 |
|
Volgograd |
238,1 |
Ufa |
75,7 |
|
Saratov |
174,5 |
Total |
5166,4 |
Fig. 5. Tariff rates on the routes to Sochi and from Sochi: a - air tariffs; b - railway tariffs (in compartment cars)

In 2016 passenger transportation from Moscow to Sochi by railway amounted to 10% of the total sum of transportation to Sochi by railway transport in all directions. Other largest destinations for railway passenger transportation from Sochi are shown in Table. 10. More than 70% of passenger railway transportation to and from Sochi was carried out on the major routes.
The growth of the passenger air transportation to and from Sochi can be ensured by increasing the number of flights on those routes where there is considerable railway transportation and where air transport is in many ways inferior to it or not used. The list of potentially possible routes of air transportation from Sochi is given in Table. 11. The average range of transportation is up to 1000 km.
In 2016, 159 million passengers were transported by air and railway transport on the territory of the Russian Federation, including 35% by air transport (for comparison: in 2014 - 32%).
The share of air transportation grows with an increase in the range of passenger traffic (Table 13).
At distances of up to 2500 km more than 90% of passenger transportation is carried out by two modes of transport: 97% by railway from the total volume of railway transportation and 83% by air from the total volume of air transportation.
At distances of up to 1000 km 60% of passenger transportation is carried out by two modes of transport: 77% by railway from the total volume of railway transportation and 26% by air transport from the total volume of air transportation.
Table 11
Potential directions for increasing air transportation from/to Sochi to the indicated destinations, thousand passengers
|
Point of destination |
Interval of distance, km |
2016 |
2014 |
The share of air transportation, % |
|||
|---|---|---|---|---|---|---|---|
|
Railway transport |
Air transport |
Railway transport |
Air transport |
2016 |
2014 |
||
|
Krasnodar |
Up to 500 |
1263878 |
62220 |
1004818 |
92131 |
5 |
8 |
|
Stavropol |
Up to 500 |
20467 |
375 |
27449 |
— |
2 |
|
|
Minerahiy Vody |
Up to 500 |
306927 |
4435 |
353854 |
2155 |
1 |
1 |
|
Starommskaya (Yeysk) |
Up to 500 |
47301 |
— |
26107 |
— |
— |
— |
|
Salsk |
Up to 500 |
45507 |
— |
54656 |
— |
— |
— |
|
Annavir |
Up to 500 |
442883 |
— |
308983 |
— |
— |
— |
|
Vladikavkaz |
Up to 500 |
110879 |
165 |
123858 |
— |
0,1 |
— |
|
Rostov-on-Don |
Up to 500 |
669447 |
6028 |
692730 |
605 |
1 |
0,1 |
|
Millerovo |
Up to 500 |
33164 |
— |
33979 |
— |
— |
— |
|
Volgograd |
501-1000 |
238129 |
18427 |
228117 |
— |
7 |
— |
|
Voronezh |
501-1000 |
274674 |
9725 |
229472 |
177 |
3 |
0 |
|
Kursk |
1001-1500 |
50477 |
1164 |
36946 |
1465 |
2 |
4 |
|
Michurinsk |
1001-1500 |
23950 |
|
23360 |
— |
— |
— |
|
Ruzaevka (Saransk) |
1001-1500 |
26018 |
— |
28812 |
— |
— |
— |
|
Saratov |
1001-1500 |
174460 |
6239 |
161642 |
6187 |
3 |
4 |
|
Bryansk |
1001-1500 |
50190 |
4402 |
50104 |
76 |
8 |
0,2 |
|
Tambov |
1001-1500 |
21666 |
— |
18144 |
1569 |
— |
8 |
|
Tula |
1001-1500 |
32183 |
— |
28409 |
— |
— |
— |
|
Orel |
1001-1500 |
21296 |
— |
18299 |
— |
— |
— |
|
Ulyanovsk |
1001-1500 |
74606 |
3142 |
55363 |
— |
4 |
— |
|
Ryazan |
1501-2000 |
54502 |
— |
57589 |
— |
— |
— |
|
Yaroslavl |
1501-2000 |
62461 |
5745 |
53352 |
157 |
8 |
0,3 |
|
Syzran |
1501-2000 |
40849 |
— |
33640 |
— |
— |
— |
|
Vladimir |
1501-2000 |
22176 |
— |
20353 |
— |
— |
— |
|
Smolensk |
1501-2000 |
29691 |
— |
22270 |
— |
— |
— |
|
Izhevsk |
1501-2000 |
74810 |
6515 |
56913 |
6120 |
8 |
10 |
|
Vologda |
2001-2500 |
60547 |
— |
47079 |
9 |
— |
0,02 |
|
Orsk |
2501-3000 |
27606 |
— |
22004 |
— |
— |
— |
|
Total |
|
4300744 |
128582 |
3818302 |
110651 |
2,9 |
2,8 |
Table 12
The problems of airports, which restrict the use of the Russian jet aircraft SSJ-100
|
Railway station |
Problem description |
|---|---|
|
Starominskaya |
Located in 65 km from the Yeysk airport, which belongs to the Ministry of Defense. It is planned to create a civil air traffic on the basis of the military airport |
|
Salsk |
Salsk-2 is a functioning airfield of civil aviation. Located on the southern outskirts of the city of Salsk. It is used for aerial work. Its reconstruction is planned in accordance with the "Development Strategy of the Transportation Complex of the Rostov Region until 2030" |
|
Annavir |
"Armavir" airfield of the 4th class, without hard surface, is capable of serving light aircraft and helicopters of all types. Passenger transportation is not carried out. There is also a military airfield near Annavir. |
|
Millerovo |
The military airfield is located in 5 km to the north-west of the city of Millerovo in the Rostov region, Not used for civilian transportation. On the north-eastern outskirts of Millerovo there is a landing ground for civil aviation "Millerovo", which is used for aviation works. |
|
Michurinsk |
General-purpose aerodrome. Short mnway (1000 m). Half of the mnway is in poor condition |
|
Ruzaevka |
Located in 26 km from Saransk. On Febmary 14, 2018 the airport of Saransk received the first regular flight after its reconstruction for the World Cup Championship in 2018 |
|
Bryansk |
A functioning airport, the classification number of runways 24/R/B/w/T with the necessary number more than 27. Requires reconstruction of the mnway, modernization of equipment and building of ground infrastructure. The airport’s reconstruction is included in the Federal Program for Transport Development in 2018-2020 |
|
Tambov |
The characteristics of the airstrip of the functioning airdrome “Donskoy e” - 10/ R/c/w/T with the necessary number more than 27 |
|
Tula |
Klokovo is a military airfield on the northern outskirts of the city of Tula. In the civil part of the aerodrome there is a landing site “Tula”, which receives helicopters of all types, as well as light and ultra-light aircraft |
|
Orel |
It does not function since 2010, because it was excluded from the State Register of CivilAerodromes of the Russian Federation (closed down temporarily) |
|
Ryazan |
The civil airport Turlatovo is used for the training of parachute jumpers. In the distant future it is planned to reconstruct the Protasovo airport for civil air traffic |
|
Sizran |
Belongs to the Ministry of Defense. Used for the training of cadets of the Syzran Higher Military Aviation School (SVAShP). |
|
Vladimir |
“Semyazino” airport. The maximum take-off weight of an aircraft is 25 tons. Classification number of the airstrip is 28/F/D/X/T. In 2017 flights were carried out on Embraer 145 aircraft of the airline “Komiaviatrans” |
|
Smolensk |
Test aerodrome of the I st class in the city of Smolensk, located in 3 km north of the Smolensk railway station. In 2009-2010 the aerodrome was occasionally used to receive civilian aircraft with one-time permits |
|
Vologda |
A functioning airport, classification number of the aerodrome’s runway 13/R/B/X/T, for the operation of the aircraft SS.T-100 more than 27 is needed |
T
able 13
Thedistribution of passenger transportation by distance in 2016
|
Indicator |
Up to 500 |
501-1000 |
1001-1500 |
1501-2000 |
2001-2500 |
Total |
|---|---|---|---|---|---|---|
|
Passenger transportation by two modes of transport in 2016, cmnulatively |
47,7 |
90,3 |
121,5 |
134,2 |
141,0 |
159,0 |
|
The share in total volumes of passenger traffic,% |
30 |
57 |
76 |
84 |
89 |
100 |
|
Air passengers in 2016, cumulatively |
1,9 |
14,6 |
34,6 |
41,9 |
46,8 |
56,3 |
|
The share in total volumes of passenger traffic,% |
3 |
26 |
61 |
74 |
83 |
100 |
|
Passengers of railway transport in 2016, cumulatively |
45,8 |
75,8 |
86,8 |
92,2 |
94,2 |
102,6 |
|
The share in total railway and air transportation,% |
45 |
74 |
85 |
90 |
92 |
100 |
|
Specific weight of air transportation,% |
4 |
16 |
28 |
31 |
33 |
35 |
In transportation at a distance of up to 500 km the share of air transport accounts for 4% and in the range of distances up to 1000 km - 16%, in the range of distances up to 2500 km the share is 33%.
At a range of over 2501 km 9,5 million passengers are transported by air transport and about 3 million passengers - by railway. The share of air transportation reaches 80%. For long distances of over 5000 km 99% of passengers are transported by air.
The airports of Moscow function as transfer nodes. Domestic air transportation is concentrated on routes to Moscow and from Moscow (75%). Flights without intermediate landings will become economically viable with increasing traffic volumes and loading capacities of passenger flights on long-distance routes.
It is possible to unburden the airports of Moscow if a network of hub international airports is developed on the country’s territory.
The airline tariffs exceed the railway ones (when traveling in compartment cars) on short distances (up to 1000 km) and on routes to hard-to-reach areas where there is no competition with the modes of land transportation. The high tariff rates of air travel for short distances are related to certain specific features: the main resources are spent on takeoffs and landings, planes have a relatively smaller payload and higher unit costs. These factors are not taken into account in the adopted algorithm for the formation of airport charges.
An increase in air transportation is influenced by:
The development of regional traffic is possible on the condition of modernization of regional airfields and changes in airport charges taking into account the specifics of short-distance flights.
1. AIP of Russian Federation// FSUE «Centre of aeronavigation information». URL: http://www.caiga.ru/common/?lang=ru.
2. Population activity in usage of transport services. Bulletin of social and economic crisis in Russia (2015)/Under the guidance of L. Gryhoriev, А. Goliashev, А. Lobanova and others // Analytical center affiliated to the Government of Russian Federation. № 7. 22 с. URL: http://ac.gov.ru/files/publication/a/7059.pdf.
3. Analytical reviews of А. Fraiman ( [b.g.]) // Institute of automatized technologies for the air transport. URL: http://www.iatvt.ru/index.cgi?doc=11.
4. Base of airdrome ( [b.g.]) // Interregional public organization of pilots and citizens – owners of aerial vehicle (RASPA). URL:http://maps.aopa.ru.
5. Annual report 2016 //Russian Railways. URL: http://ar2016.rzd.ru/pdf/ar/ru/ru-annual-report-pages.pdf.
6. Diagram of flexible regulation of tariffs for passengers’ transportation for long distances in trains of JSC «FPK», bound within the state in 2018: in sleeping and general cars (using the passengers’ cars of locomotive traction), as well as in multiple unit // Russian railways. URL: http://pass.rzd. ru/static/public/ru?STRUcTURE_ID=5106.
7. Iliin I.P., Maskaieva Y.Y. (2016) Price competition of air and railway transport // Association «Zheldorrazvitiie». URL: http://zdrazvitie.ru/analytics/publikatsii/tsenovayakonkurentsiya-vozdushnogo-i-zheleznodorozhnogotransporta/.
8. Information on transportation between the flight points 2015–2016. Statistical anthology (2016) // Transport and clearing-house. URL: https://arch.tch.ru/statistics/coll_citypairs
9. Calendar of low prices ( [b.g.]) // Aviasales.ru. URL: https://www.aviasales.ru/calendar.
10. Nesterov Y. V.,Fraiman А. B. (2014) Paradigm of strategy of air transport control // Transport of Russian Federation. № 2 (51). С. 24–29. URL: http://www.rostransport.com/transportrf/archiv/510/.
11. On approval of tariff guide № 4, book 3 «Tariff distance between transit stations of railways of federal railway transport»: Order of Ministry for traffic connection of RF dated 15.07.2003 № 55 (reading dated 18.03.2011) // Russian Railways. URL: http://doc.rzd.ru/doc/public/ru?STRUcTURE_ID=704&layer_id=5104&refererLayerId=5103&id=2060.
12. Passenger transportation 2016 // RR. URL: http://www.rzd.ru/static/public/ru?STRUcTURE_ID=5227.
13. Passenger transportation and passenger turnover for 2016–2017 // Federal agency for air transport (Rosaviation). URL: http://www.favt.ru/dejatelnost-vozdushnyeperevozki-perevozki-passazhirov/.
14. Order of FTS of Russia dated 27.07.2010 № 156-т/1 (reading dated 23.12.2016) «On confirmation of tariffs, fees and charges for works (services), related to passengers, luggage and и cargo-luggage transportation by railway transport of general use within state transport connection and run of passenger cars performed with the the comparison of passenger traffic by air and railway transport long-distance trains of OJSC «Russian railways», OJSC «Federal passenger company», OJSC «Passenger company «Sakhalin», OJSC «JSC «Railways of Yakutia» and for works (services) on usage of infrastructure of railway transport of general use, provided by OJSC «Russian railways», OJSC «JSC «Railways of Yakutia», for these transportation, prices (tariffs) for works (services) on usage of infrastructure of railway transport of general usage, Provided by OJSC «Russian railways» performing the passengers, luggage and cargo-luggage transportation by railway transport of general use in commutation service in subjects of Russian Federation,and rules of their implementation (Tariff guide)» // Cunsultant Plus. URL:goo.gl/nnrc2z.
15. Routing directory for air traffic service of Russian Federation // FSUE «Centre of aeronavigation information». URL: http://www. caiga.ru/DocAni/manual_of_path_ovd/manual_ovd/ATS_ Routes_Manual_07–12–2017.pdf.
16. Rates of fees of RF airports// Transport and clearing house. URL: http://cstweb2.tch.ru/info2/index.html.
17. Transport of Russia. 2016. January-December // Ministry of Transport of Russian Federation. URL:https://www.mintrans.ru/documents/7/7249.
18. Yurkivich М., Kazunina А. (2013) Analysis of market of passenger transportation for the long distance (with the example of city of Moscow) // logistics. № 6. P. 20–24. URL: http://www.logistika-prim.ru/articles/analiz-rynkapassazhirskikh-perevozok-v-dalnem-soobshchenii-naprimere-g-moskvy.
19. National Transportation Statistics 2016 // Bureau of Transportation Statistics, U. S. Department of Transportation. URL: http://www.bts.gov/publications/national_transportation_statistics/
20. Performance of Passenger Transport expressed in passenger-kilometre: European commission Directorate-General for Mobility and Transport- Statistical pocketbook 2017 // European commission. URL: https://ec.europa. eu/transport/facts-fundings/statistics/pocketbook-2017_en.
Ph.D. in Economics, assistant professor of the Department of Financial Management at the FGOBU VO “Stankin Moscow State Technological University”. Research interests: air transport economics
Manvelidze A.B. Comparison analysis of passenger traffic by air and rail transport. Strategic decisions and risk management. 2018;(1):88-101. https://doi.org/10.17747/2078-8886-2018-1-88-101
Ligovsky av 73, of.401, Saint Petersburg, 190040, Russia
Tel.: +7 (812) 346-50-15 (16)
Real Economy Publishing House.
E-mail: info@jsdrm.ru
Registration certificate PI No. FS-77 - 72389 from 02.28.2018, issued by the Federal Service for Supervision in the Sphere of Communications, Information Technologies and Mass Communications.
Processing of personal data


