


Contents
Scroll to:
https://doi.org/10.17747/2618-947X-2021-4-284-298
Scroll to:
This paper is devoted to the study of the correlation between the perceived significance of indicators of innovation activity and their actual use at enterprises of the Russian manufacturing industry. A sample of 132 manufacturing enterprises in Russia was used for the analysis. It was found that the recognition of the significance and the actual use of financial and non-financial indicators varies significantly depending on the affiliation of companies to a particular innovation regime: radical innovators, technological innovators, effective producers, creators of value innovations and imitators. Three key performance indicators (KPIs) reflecting the company's focus on the introduction of technological innovations (the share of modern equipment in the company's technology park (taking into account the technological features of industries); the average time to adapt the acquired innovative product, days; the share of implemented patents from the total number of patents received by the organization) were recognized as important managers of companies belonging to technological and radical innovators (74.5, 76.9, 78.1%, respectively). Three key performance indicators reflecting customer orientation (the number of new categories of products or services introduced in the reporting year; the share of products certified according to international standards in the total production of the company; the percentage of innovative expenditures on the modernization of existing products/processes/business models in relation to the total innovative expenditures on products/processes/business models) were recognized as important companies classified as effective producers and creators of value innovations (83.4, 81.9, 76.8%, respectively).
But at the same time, the study showed that the most commonly used indicators are sales growth from new products (88.7%); the share of patents implemented (74.3%); total R&D expenses per 1 thousand dollars of revenue in the current reporting period (89.2%). In summary, conclusions are drawn about the actual application of key performance indicators of innovation activity by companies.
Trachuk A.V., Linder N.V. KEY INDICATORS OF INNOVATION PERFORMANCE: PERCEPTION OF SIGNIFICANCE AND PRACTICAL APPLICATION. Strategic decisions and risk management. 2021;12(4):284-298. https://doi.org/10.17747/2618-947X-2021-4-284-298
The introduction of innovations as a source of competitiveness between industrial companies contributes to the fact that the issues of assessing the effectiveness of innovative activities attract more and more attention among researchers and experts [Klein et al., 2001; Glassman, 2009; Trachuk, Tarasov, 2015]. At the same time, a number of specialists consider the effectiveness of innovation activity as one of the most significant [Dennis, 2003; Morris, 2008; Glassman, 2009].
It should be noted that despite a fairly developed classification of innovation metrics, they were all developed by foreign researchers, and the possibility of their application in the practice of Russian industrial companies has not been sufficiently studied. There are no empirical studies which analyze the use of metrics by Russian industrial companies. An overview of the existing classifications related to innovation performance metrics is given by the authors in the articles [Trachuk, Linder, 2016; 2019; Trachuk and Linder, 2019].
The studies of foreign authors on the use of key performance indicators show that investments in innovative technologies, such as lean manufacturing, customer relationship management (CRM), enterprise resource planning (ERP) and rapid prototyping cannot successfully complete the implementation stage and evaluate improvements [ Dennis, 2003] as efforts on implementation must be monitored and diagnosed [Shiba et al., 1993].
In addition, evaluating the effectiveness of innovations provides an opportunity to identify problems and weaknesses and to take corrective action before these problems escalate [Kueng, 2000].
The purpose of this study is to analyze the perception and actual application of key performance indicators of innovative activities by industrial companies.
The choice of industry is explained by several reasons. First, it is industrial companies that have the largest investments in innovation. Secondly, during an economic downturn and limited access to financial capital, industrial companies will assess the effectiveness of investment in innovation more closely. Thirdly, due to the peculiarities of the industrial sector, justifying the costs of innovation activities through the introduction of key performance indicators is one of the highest priority tasks.
To achieve this goal, a task was set based on the classification of innovations and innovative metrics existing in the academic literature, which were described by the authors earlier [Trachuk, Linder, 2019;], to study which of them are recognized by practitioners as the most significant and which of them are most often used in practice. As part of the empirical approach, in-depth interviews and questionnaires with representatives of the top management of Russian industrial companies were conducted.
In academic research, there are several areas for assessing the effectiveness of innovation.
The earliest one was performance evaluation based on financial indicators such as return on investment [Norman, Bahiri, 1972; Barbosa, 2004]. However, later this approach was criticized, since, according to researchers, it does not provide feedback on the effectiveness of internal business processes and the contribution of employees to achieving this efficiency [Kaplan, Norton, 1992; Abdel-Maksound, 2004].
Therefore, in the future, researchers began to offer indicators that measure the innovation process and innovative activity of companies, for example [Morris, 2008].
However, no single performance indicator can capture the full complexity of innovation activity [Amaratunga et al., 2001]. To be successful in today's globally competitive environment, organizations must be able to capture objective (e.g. unit costs, profit) and subjective (e.g. quality, satisfaction) measures. Therefore, researchers began to propose models that allow for the evaluation of innovative activity in a complex way [Coombs et al., 1996; Verhaeghe and Kfir, 2002; Gupta, 2007; Ortiz et al., 2007].
Other researchers began to use econometric modeling to analyze the relationship between innovation and company performance [Lööf, Heshmati, 2002; Mairesse and Mohnen, 2004].
A number of other authors have proposed the use of multidimensional indicators [Salomo et al., 2008; Good, Tellis, 2009; Choi, Ko, 2010], as well as to investigate the effectiveness of balancing financial and non-financial indicators in the performance evaluation system [Kerssens van Drongelen, Bilderbeek, 1999; Hudson et al., 2001; Kanji and Sa', 2002; Savioz, Blum, 2002; Bremser and Barsky, 2004].
In addition, some studies have emerged that focus on the use of financial and non-financial indicators by companies and assessment of their perceived importance. The results of such studies have led to the conclusion that there is a direct relationship between a company's assessment of the perceived significance of an indicator and its actual use, for example [Kaplan, Norton, 1993; Cox et al., 2003].
A variety of approaches to measuring the effectiveness of innovation activity is presented in Table 1.
Thus, the considered approaches can be divided into the following groups depending on their focus:
1) related to the innovation process;
2) indicators grouped in a balanced scorecard;
3) other approaches, for example in relation to the innovation climate or the ability to innovate.
Models of the first group use the idea of measuring the "input – process – output" of innovation activity [Goffin, Mitchell, 2010; Tidd and Bessant, 2014]. Some authors, in particular [Möller et al., 2011], propose to separate the concepts of “output” as a short-term effect and “result” as a long-term effect, as well as the system for obtaining the result (for example, marketing and sales efforts) and the result itself [Vahs and Brem, 2015]. Thus, the Input – Process – Output – Outcome (IPOO) model uses specific indicators for each stage of the company's innovation process, such as the training cost of one employee at the entry stage and the number of new products at the exit stage [Fischer et al., 2015].
It should be noted that the use of outcome criteria such as market share gained through innovation, etc., entails two distortions:
– firstly, one cannot be sure of obtaining reliable measurement results, since a sufficiently large amount of time can pass between the introduction of an innovation and its positive effect;
– secondly, there is a difficulty in clear distinguishing the effect of innovation from other factors that could lead to a measured increase in a market share.
Along with complex approaches to measuring the innovation process, there are approaches in the research that focus on certain aspects of the process. For example, the R&D Return system [Vahs, Brem, 2015] was created to evaluate performance in R&D only. In this approach, R&D productivity is measured by the potential productivity and efficiency of technology development and compared with the R&D profitability which consists of potential productivity and operational efficiency. In addition, to calculate the value of the return on R&D, a certain algorithm is used that combines all indicators. This system can be transferred to other business units of the organization.
In contrast to these scoring systems, Bean consulting company proposed to simply quantify the innovative output of the R&D department [Pappas, Remer, 1985]: the number of patents, publications, citations, etc. or simply by counting the number of new ideas [Fuchs, 2014].
The second group of approaches includes those based on a balanced scorecard, such as the Innovation Balanced Score Card [Fischer et al., 2015]. The four dimensions of a typical balanced scorecard (finance, customers, internal business processes, learning, and growth [Kaplan, Norton, 1992]) are assessed with the help of a company's innovation strategy with a focus on improving the effectiveness of innovation, such as time to market for a new product, market share obtained through R&D [Žižlavský, 2016].
Another assessment method is innovation audits. When conducting an innovation audit, not only the results of innovative activities (output indicator) are considered, but also how these results were achieved (process indicator). For this, aspects such as innovation strategy, market, product, technology, etc. are evaluated. [Goffin, Mitchell, 2010]. Examples of such indicators for the “market” aspects are: change in market share thanks to new products, number of customer surveys, number of implemented innovations based on customer ideas, etc. [Warschat, 2005] or 5 measurements of A.T. Kearney "House of Innovation" or Improve [Innovety, 2014].
The group of other approaches is diverse. They usually have a specific focus, such as INNO assessing the innovation climate [Kauffeld et al., 2004] or describing general determinants of innovation ability [Jong et al., 2001]. Some of the used criteria intersect with other approaches, some are specially adapted to a specific task (for example, export activity) [Jong et al., 2001].
Thus, there is a wide variety of metrics to measure innovation in companies or business units. They vary widely in complexity and data requirements involving effort to collect and analyze data. In choosing the right approach for a particular situation, the differentiating criterion should probably be the availability of the resources necessary to collect and analyze the data.
Separately, it is possible to single out the indicators used for the operational control of innovation activity focused on the indicators for the implementation of innovative projects [Fischer et al., 2015].
Similar to the due diligence method, indicators of typical project control are proposed, such as control of project stages or budget [Maier et al., 2007; Vahs and Brem, 2015]. In other studies, the effectiveness of innovative projects is measured by the duration of a new product development and its costs [Fuchs, 2014] or the return on investment of innovative projects [Hauschildt, Salomo, 2007]. In addition, some studies argue that the only way to assess innovation activity is to evaluate the progress of these innovation projects [Littkemann, Derfuß, 2011]. However, this argument ignores the fact that innovation in a company is not always associated with projects, but the whole company including project activities, teamwork, should strive to be innovative [Fischer et al., 2015]. Thus, in addition to measuring the effectiveness of innovative project implementation, indicators are necessary to evaluate the achievements of innovative teams.
The purpose of this study is to analyze which of innovation efficiency indicators are used by Russian industrial companies, which of them are perceived by management as significant, and whether the use of the indicator depends on the recognition of its significance for the success of innovation. In addition, it is interesting to answer the question how much the implementation of an innovation strategy and the company's adherence to one or another type of innovative behavior will affect the perceived significance of indicators for assessing the effectiveness of innovative activity and their use.
The hypotheses of this study are:
H1. The perceived importance of KPIs will differ depending on the type of innovative behavior an industrial enterprise pursues: radical innovators, technological innovators, efficient producers, value-innovators, or imitators.
H2. For technological and radical innovators, non-financial performance indicators of innovation activity will be the most significant, and for creators of value innovations, efficient producers and imitators, financial performance indicators of innovation activity will play a great role.
H3. For companies of all innovation regimes, there will be a positive relationship between the perceived importance of the indicator and its actual use in innovation performance assessing.
Since the design of an exploratory study was chosen to achieve the goal of the work, in-depth interviews became the main method of collecting information at the first stage. At the second stage, a survey of top management representatives of industrial companies was used. The methodology of the first and second stages of the study is presented in Table 2.
Since the design of the study involves the participation of one to five employees from each company, a total of 37 respondents were interviewed – heads of departments involved in innovation activities (in particular, respondents held the positions of heads of R&D departments, heads of research institutes, strategic planning departments, etc.), as well as deputy top managers for innovation, science and development. Interviews took place from October to November 2021 in person or via videoconference. The duration varied from 30 minutes to 1 hour. The average interview time was 45 minutes.
At the second stage, 589 questionnaires were sent to representatives of Russian industrial companies. Feedback was received from 139 companies, the response accounted for 23.6%. The high response rate is explained by the fact that some of the questionnaires were distributed among students on additional professional education programs from the Faculty of Higher School of Management of the Financial University, where the authors deliver lectures. The survey took place from December to February 2022.
When forming the sample, the following criteria for selecting companies were determined. Firstly, the company must belong to the manufacturing industries and operate on the territory of the Russian Federation. Secondly, the company must be engaged in innovative activities, and thirdly, the number of employees of the company must be more than 100.
Since the hypotheses of the study require a breakdown of the set of enterprises according to the type of innovative behavior, then they were further broken down in accordance with the characteristics inherent in a particular type of innovative behavior, described in the article [Linder, 2020] and presented in Table 3.
The distribution of companies by the type of innovative behavior is presented in Table 4. The characteristics of the companies included in the sample are presented in Table 5. It should be noted that the R&D expenses of the sample companies are characterized by an extremely wide spread.
Table 1
Approaches to measuring the effectiveness of innovation in organizations
|
Author / model name |
Analysis level |
Indicator type |
Used indicators |
Reference |
|
Input- Process- Output- Revenue Model (IPOO) |
Company |
Financial and non-financial |
For example, [Möller et al., 2011]: Entrance: quantitative: the cost of R&D, the number of ideas, the cost of training of one employee; quality: employee experience, quality of ideas Process: quantitative: working hours on the project, the number of results achieved in time; qualitative: product/service quality, progress Exit: quantitative: number of patents, number of new products, average cost per patent qualitative: synergetic effect, results of fundamental research; Income: quantitative: increase in sales/profits, cost reduction; quality: product improvement, customer satisfaction |
A similar approach to measurement is also supported by other authors, for example [Fischer et al., 2015; Vahs, Brem, 2015] |
|
Balanced Scorecard for Innovation |
Company |
Financial and non-financial |
Example of balanced scorecard with an emphasis on improving the efficiency of innovation [Fischer et al., 2015]: Sales of new products in relation to required investments, time to entry the market for a new product Market share gained through R&D |
The approach describes the implementation of a balanced scorecard with a particular focus on innovation success. |
|
Innovation Audit Scorecard (InnoAudit-Scorecard) |
Company |
Financial and non-financial |
Innovation audit considers not only the results of innovation activities (outcome indicator), but also how these results were achieved (process indicator) [Goffin, Mitchell, 2010. P. 317). Indicators are defined for various aspects, such as market, project management, product, innovation culture, know-how, etc. [Warschat, 2005] |
InnoAudit-Scorecard is a tool for self-diagnosing of companies and identifying the potential for improving the efficiency of innovation in each particular company [Warschat, 2005. P. 13] |
|
[Goffin, Mitchel, 2010] |
Company |
Financial and non-financial |
The metrics of this approach are similar to the quantitative metrics of the IPOO model. IPOO inputs and outputs constitute Goffin’s “aspect outcome” [Goffin, Mitchell, 2010. P. 316] |
|
|
Improvement |
Company |
Financial and non-financial |
The indicators are grouped into 5 areas: innovation strategy, innovation culture, innovation life cycle processes, enabling factors and outcomes of innovation. Examples of indicators are - time to market for a new product / profit, customer feedback, management of the flow of innovations and ideas, ability to innovate, etc. [Innovety, 2014. P. 5] |
Measuring the effectiveness of a company's innovation process with the Improve tool is based on A.T. Kearney [Innovety, 2014. P. 5] |
|
[De Jong et al., 2001] |
Company |
Financial and non-financial |
The model includes 50 determinants, which are grouped into 9 categories: personnel characteristics, innovation strategy, innovation culture, structure, availability of financial resources, network activities, company characteristics, innovation infrastructure and market characteristics [De Jong et al., 2001. P. 9- ten] |
The model describes the determinants of an organization's innovative capabilities. [De Jong et al., 2001. P. 9] |
|
Author / model name |
Analysis level |
Indicator type |
Used indicators |
Reference |
|
Innovation statistics (surveys) (e.g. CIS Finland, ZEW Germany) |
Company |
Financial and non-financial |
Examples of observed indicators [Rammer et al, 2016]: Number of product innovations/process innovations, innovation activity in the last 3 years, number of new products, surveys regarding innovation barriers, etc. |
Typically, these data are used to measure innovation performance in addition to more traditional measures such as patents. [Leiponen, Helfat, 2006. P. 9] |
|
[Michie, Sheehan, 2003] |
Company |
Non-financial |
Firms were asked the following questions: “Over the past three years, how many product innovations has the company introduced?” and “In the last three years, how many process innovations has the company introduced?” [Michie, Sheehan, 2003. P. 129] |
|
|
Bean counting |
Business unit |
Non-financial |
Examples of indicators: number of patents, publications, citations, etc. [Pappas, Remer, 1985] |
The goal is to quantify the productivity of R&D personnel [Pappas, Remer, 1985. P. 18] |
|
(R&D Return Framework) |
Business unit |
Financial |
The indicators of the system for assessing the profitability of R&D are [Vahs, Brem, 2015. P. 648]: R&D productivity - the potential productivity and efficiency of technology development R&D profitability - potential profitability and operational efficiency |
With this approach, the overall value of the efficiency of the R&D department is calculated |
|
INNO |
Business unit |
Non-financial |
The INNO assessment tool consists of 21 items divided into four groups of factors: (1) innovative leadership, (2) constant questioning, (3) consistent implementation, and (4) professional documentation [Kauffeld et al., 2004. P. 155] |
ITCI is “a measure of the group climate in organizations and is used in team building and organizational development” [Anderson et al., 2014. P. 255] |
|
Team Climate Indicator |
Business unit (department) |
Non-financial |
The TCI indicator measures 38 questions [Anderson et al., 2014. P. 246] regarding team goals, friendliness of team members, ability to come up with new ideas, assessments of weaknesses, evaluation of work, ways to solve problems, etc. |
TCI является «мерой группового климата в организациях и применяется при формировании команды и развитии организации» [Anderson et al., 2014. P. 255] |
|
Complex assessment method |
Project |
Non-financial |
Indicators for evaluating technology, technological progress compared to existing products, as well as leadership in R&D, availability of necessary know-how, etc. |
Technological aspects and market prospects of an innovative product are assessed with the help of expert interviews and panels [Vahs, Brem, 2015. P. 346] |
|
Fuchs |
Project |
Non-financial |
Innovative efficiency should be measured by the duration of the development of a new product, the costs of developing a new product, the assessment of the level of novelty compared to the average market turnover / profit achieved [Fuchs, 2014. P. 31] |
Based on the results from individual projects, the company's innovative activity is analyzed [Fuchs, 2014. P. 31] |
The source: compiled by the authors.
Table 2
Description of the stages of empirical research
|
Stage 1 |
Stage 2 |
|
|
Stage goal |
To identify metrics that industrial companies consider important when evaluating their innovation performance |
To identify the features of innovative metrics’ application by Russian industrial companies |
|
Research question |
What metrics of company’s innovation activity are considered the most important for evaluating the effectiveness? What are the relationships between quantitative and qualitative metrics? |
What innovation metrics do industrial companies use? Who in the company is responsible for evaluating innovation activities? What is the process of evaluating innovation activities? Does the company develop its own metrics to measure innovation performance? |
|
Data collecting method |
37 in-depth interviews |
139 questionaries |
|
Data type |
Text-oriented |
Text-oriented |
|
Data processing method |
Content analysis, emic authenticity method |
Standard methods of psychometric research that are used in the conduct of questionnaires, reliability factor analysis (Cronbach's Alpha) |
|
Instruments of the analysis |
Microsoft Excel |
Microsoft Excel |
The source: сompiled by the authors.
Table 3
Characteristics of types of innovative behavior
|
Characteristics |
Effective producers |
Technological innovators |
Creators of value innovation |
Radical innovators |
Immitators |
|
1 |
2 |
3 |
4 |
5 |
6 |
|
Intensity of investment in research and development (R&D) |
1-3% of gross revenue |
3-7% of gross revenue |
Not provided |
15-35% of gross revenue |
Not provided |
|
Types of implemented innovations |
Product and process innovations |
Product and process innovations |
Marketing and organizational innovations |
Value innovations |
Managerial innovations |
|
The level of novelty of implemented innovations |
New to the local market, new to the company |
New to the local market |
New to the local market, new to the company |
New for the world |
Pseudo innovations |
|
Building a corporate innovation system (CIS) and the presence of intercompany relationships in the innovation process |
CIS of a closed type, focused on the creation of new products due to the integration of technologies with partners |
Built on the principle of "open innovation" |
The construction of an innovation system and the features of the innovation process are determined by the presence of untapped markets and niches |
Built on the principle of "open innovation", that is, there is an extensive network of partnerships |
Of closed type or absent |
|
Cost structure for innovation activities |
Maximum investment in technology upgrades and infrastructure improvements while minimizing marketing innovation costs |
Maximum investment in product innovation |
High costs for marketing innovations, then - organizational and managerial. The costs of product and process innovations in most cases have a small share or they are absent. |
Development and implementation of new products based on the commercialization of fundamental scientific research |
Staff training costs |
|
Own R&D department |
Yes |
No |
No |
Yes |
No |
The source: [Linder, 2020].
Table 4
Distribution of industrial enterprises by type of innovative behavior
|
Innovative mode |
Radical mode |
Technological innovator |
Effective producer |
Creator of value innovations |
Imitator |
|
Number and share of industrial enterprises |
15 (11%) |
26 (18.5%) |
44 (31.7%) |
30 (21.3%) |
24 (17.5%) |
The source: сompiled by the authors.
Table 5
Characteristics of sample companies
|
All companies |
Radical innovator |
Technological innovator |
Effective producer |
Creator of value innovations |
Imitator |
|
|
Number of companies |
139 |
15 |
26 |
44 |
30 |
24 |
|
Share of companies in the sample implementing product innovations |
0.92 |
0.91 |
0.85 |
0.317 |
0.63 |
0.75 |
|
Share of companies in the sample implementing process innovations |
0.87 |
0.83 |
0.92 |
0.99 |
0.74 |
0.66 |
|
Total costs for technological, marketing and organizational innovations (million rubles) |
100 959 400 |
42 064 000 |
28 092 000 |
17 006 000 |
7 845 300 |
5 952 100 |
|
Including R&D expenses (million rubles) |
29 278 100 |
17 354 600 |
7 318 000 |
4 605 500 |
2 741 831 |
1 611 925 |
|
Average R&D expenses (million rubles) |
50 306 |
103 919 |
29 389 |
27 743 |
12 347 |
17 163.54 |
|
Median of real expenditure on R&D (million rubles) |
2675 |
4011 |
2320 |
1044 |
927 |
784 |
The source: сompiled by the authors.
All in-depth interviews were analyzed with the use of the content analysis method and checked for emic authenticity. As a result, 63 innovative metrics used by Russian industrial companies were identified and divided into 8 groups.
Table 6 presents the obtained results.
As can be seen from Table 6, Russian industrial companies most often use metrics evaluating commercialization (94%), economic effect (97%) and focus on technological innovation (78%) to assess the effectiveness of innovation.
The least frequently used metrics are customer focus (28%), intercompany collaboration (47%) and the key role of the CEO (38%).
However, it should be noted that such a distribution of metrics is not typical for all companies. The importance of certain metrics depends on what type of innovative behavior the company adheres to (Table 7).
According to the companies belonging to radical and technological innovators innovation activity, on the one hand, should have a positive effect on the results of research and development (patents, prototyping, etc.) and, consequently, on commercialization and economic efficiency, expressed in increasing productivity, cost reduction as a result of the introduction of technologies, etc. On the other hand, it is not so much the economic and financial result that is important, but the overall level of innovation activity: the amount of investment in non-key innovation projects, the level of spending on the development of fundamentally new products and services, etc.
At the same time, for the creators of value-added innovations, customer focus is important in innovative activities, which allows them to commercialize innovations effectively and, consequently, obtain a positive economic effect.
Thus, our first hypothesis is confirmed: indeed, companies that implement different types of innovative behavior consider different groups of performance indicators important for themselves.
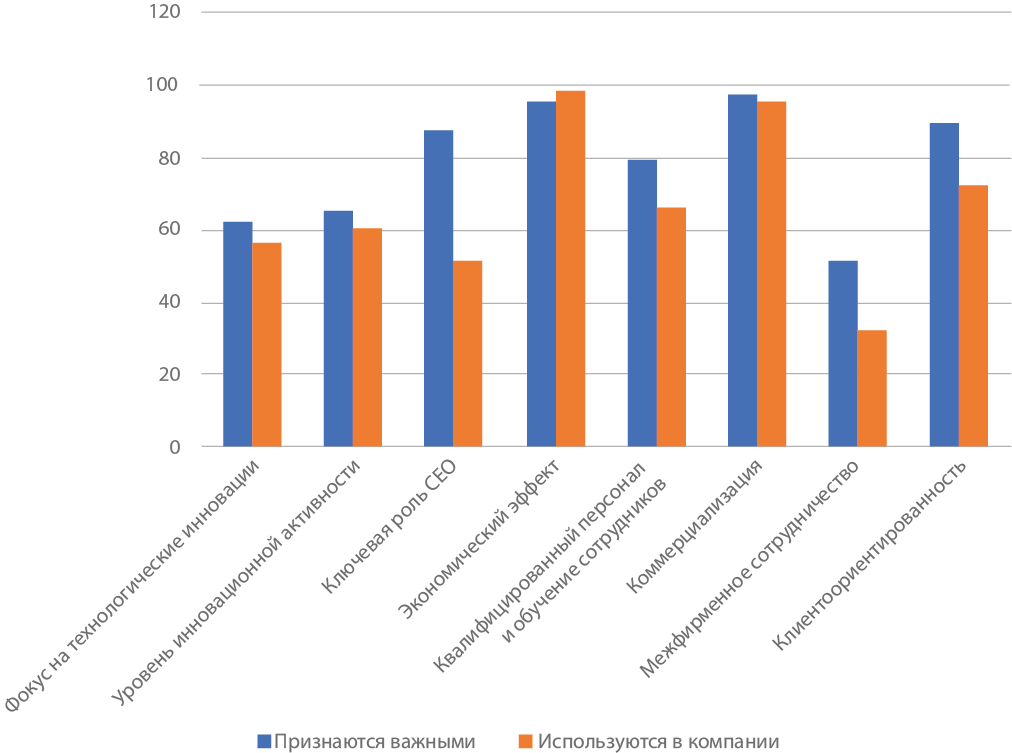
To test the second hypothesis, respondents were asked whether they consider these indicators important for their organization, and whether the organization uses them to measure the effectiveness of innovations. Since some respondents may report using metrics to measure the effectiveness of innovations whereas they do not actually use them, we applied a methodology designed to reduce the “social desirability” effect. That is, to ensure accuracy in responses, participants were asked to indicate the actual measurement systems used to collect information for each indicator. For example, respondents who reported that they measured the innovation activity level of employees engaged in innovation work should describe a measurement recording system, such as an employee survey, as the tool used to obtain this information. The results are shown in Figures 1–5.
Differences in the recognition of innovation metrics importance and their use in the company were tested by the ANOVA method to identify statistically significant differences. It turned out that the recognition of the importance and use of innovative metrics vary greatly across groups of companies, depending on the economic behavior under implementation.
It was found out that the perceived importance and actual use of innovation metrics are interrelated for companies of all innovation modes: radical innovators – Pearson's – χ2 (25, 34) = 54.27, p < 0.001; technological innovators – Pearson's – χ2(17, 55) = 67.17, p < 0.000; efficient producers – Pearson's – χ2 (31, 64) = 58.73, p < 0.000; создатели ценностных инноваций – χ2 creators of value innovations – Pearson's (29, 71) = 69.78, p < 0.000; imitators – Pearson's – χ2 (26, 59) = 66.15, p < 0.000 respectively.
It was also obtained that the perceived importance and actual use of financial metrics is higher for efficient producers, value innovators, and imitators, while the perceived importance and actual use of non-financial metrics is higher for technology and radical innovators.
Thus, the second hypothesis confirms that for technological and radical innovators the most significant will be non-financial indicators of the innovation effectiveness, and for the creators of value-based innovations, efficient producers and imitators, the most significant will be financial indicators of the innovation effectiveness.
However, the overall results show that 38-40% of technology and radical innovator companies that highly rated the importance of non-financial KPIs (i.e. quality or product/service measures, new product creation time, employee development and knowledge) did not use these key performance indicators to evaluate the effectiveness of innovation activities. Similarly, 21% of value-innovating companies that highly rated customer satisfaction did not use this KPI.
As a result, it should be recognized that there may be some potential barriers between the perception and actual use of both financial and non-financial indicators.
Thus, the third hypothesis was partially confirmed.
Table 6
Innovation metrics used by industrial companies
|
Groups of metrics |
Metrics |
Frequency of metrics’ mentioning (%) |
|
Focus on technological innovations |
Percentage of rejected patents Percentage of patents for sale Average number of prototypes per new product Percentage of new patents in a key research area Average lead time for patent applications The average time between the emergence of an idea and the receipt of a patent Average cost of a patent |
79 |
|
Level of innovation activity |
Total number of investments in non-key innovative projects New product development costs Percentage spent on developing of new products and services Percentage of investments in non-key innovative projects Percentage of resources dedicated to groundbreaking innovations Percentage of invested capital |
84 |
|
Key role of CEO |
Availability of breakthrough projects in IDP Number of technologies being designed and proposed for use Number of patents and other intangible assets put on the balance sheet based on the results of R&D Number of technologies and products developed and introduced into production based on the results of R&D performed |
38 |
|
Economic effect |
Growth in labor productivity (%) Cost reduction from technology implementation (%) The structure of expenditures on R&D Share of R&D expenses in revenue (%) R&D expenses in the reporting year (million rubles) R&D expenses per 1 employee in the current reporting period (rubles) Growth rate of R&D spending compared to the previous three years (%) Share of R&D spending on the development of fundamentally new technologies/products (%) The share of R&D costs that gave positive results in the total amount of R&D costs completed in the reporting period, % Share of R&D spending on non-key innovation projects (%) Share of R&D spending on upgrading existing technologies/products (%) Average cost of a patent (million rubles) R&D costs to the number of patents received (million rubles) |
97 |
|
Qualified personnel and staff training |
Number of tools and methodologies aimed at stimulating innovative activity among employees engaged in innovative work Number of new ideas Average time to develop a new product Number of personnel employed in the field of innovation Number of proposals for the creation of new technologies, technical and technological solutions received from subsidiaries and organizations in the accounting year |
71 |
|
Commercialization |
Share of products and services developed and put into production over the past 5 years The share of products certified according to international standards in the total volume |
94 |
|
Intercompany cooperation |
Availability of joint research programs with universities, programs to improve the quality of education and training Availability of students, graduate students and scientific and teaching staff of universities undertaking internships in the company Participation of the company in technological forecasting and activities of technology platforms The volume of joint research work with universities Development of innovative interaction with small and medium-sized businesses |
47 |
|
Customer-oriented approach |
Percentage of innovation spending on new product/process/business model categories relative to total innovation spending on products/processes/business models Percentage of innovation spending on expanding existing products/processes/business models relative to total innovation spending on products/processes/business models Percentage of innovation spending on upgrading existing products/processes/business models in relation to total innovation spending on products/processes/business models |
28 |
The source: сompiled by the authors.
Table 7
Top 3 metrics of innovation activity for industrial companies belonging to different innovation modes
|
Innovation mode |
Radical innovator |
Technological innovator |
Effective producer |
Creator of value innovations |
Imitator |
|
Number and share of industrial enterprizes |
15 (11%) |
26 (18.5%) |
44 (31.7%) |
30 (21.3%) |
24 (17.5%) |
|
Top 3 metrics most important for evaluating innovative performance |
• Focus on technological innovation • Level of innovation activity • The key role of the CEO |
• Focus on technological innovation • Intercompany interaction • Commercialization |
• The key role of the CEO • Focus on technological innovation • Economic effect |
• Customer focus • Qualified staff and employee training • Economic effect |
• Customer focus • Commercialization • Economic effect |
The source: сompiled by the authors.
Fig. 1. Importance and use of innovation performance metrics for radical innovators
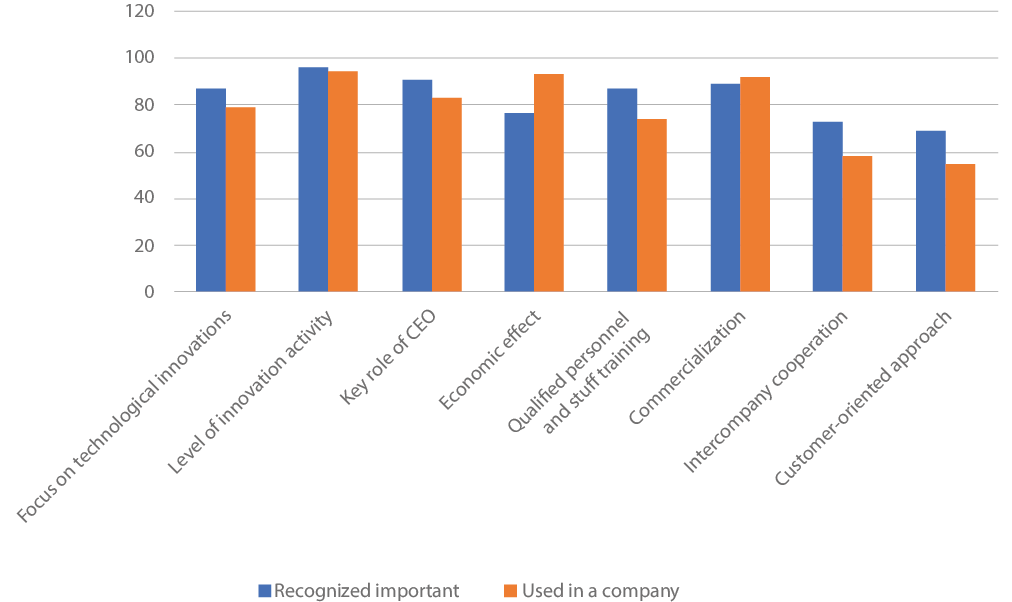
The source: сompiled by the authors.
Fig. 2. Importance and use of innovation performance metrics for technology innovators
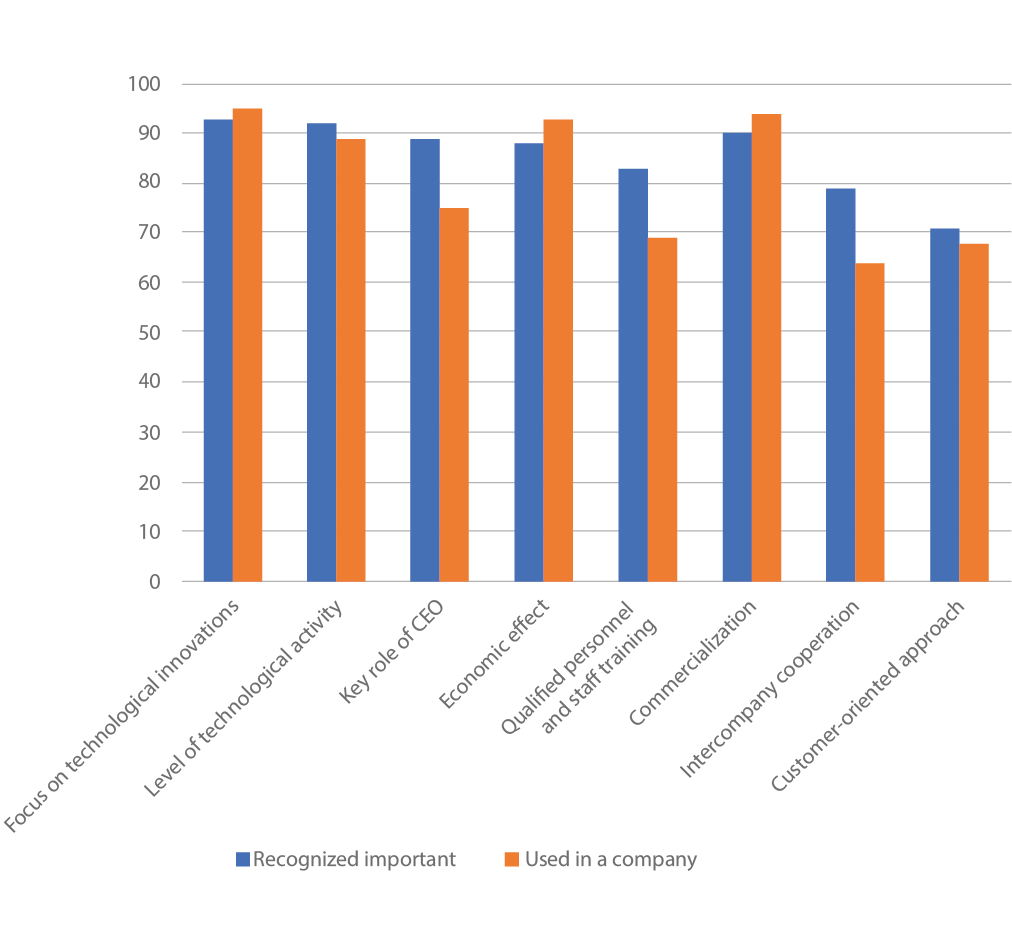
The source: сompiled by the authors.
Fig. 3. Importance and use of innovation performance metrics for efficient producers
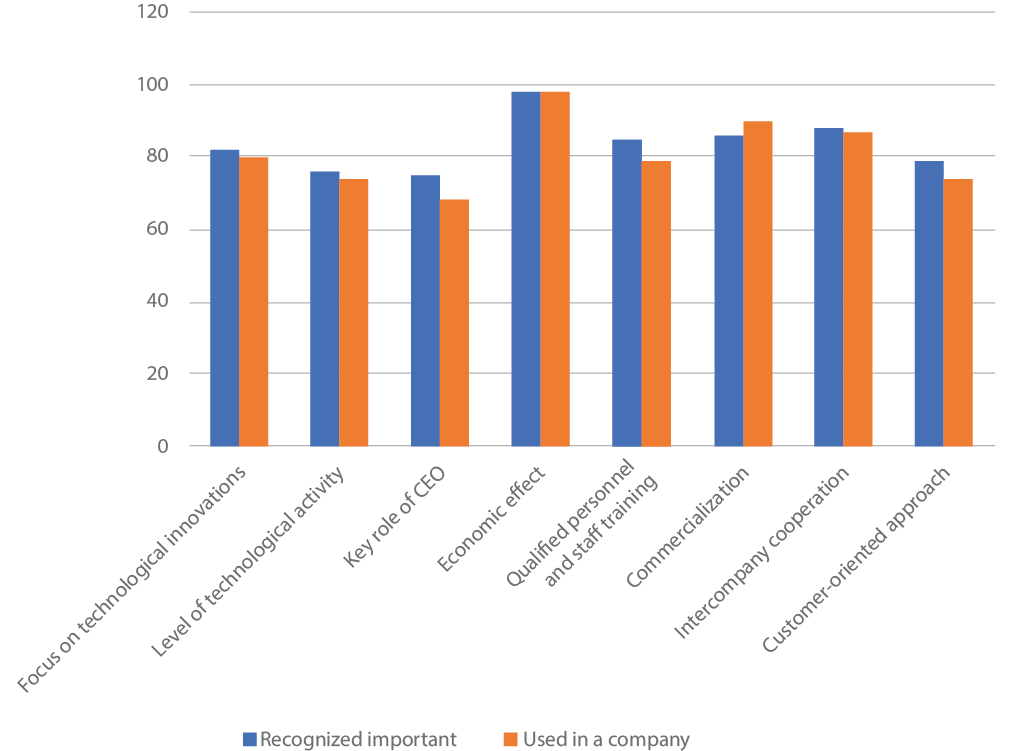
The source: сompiled by the authors.
Fig. 4. Importance and use of innovation performance metrics for value innovation creators
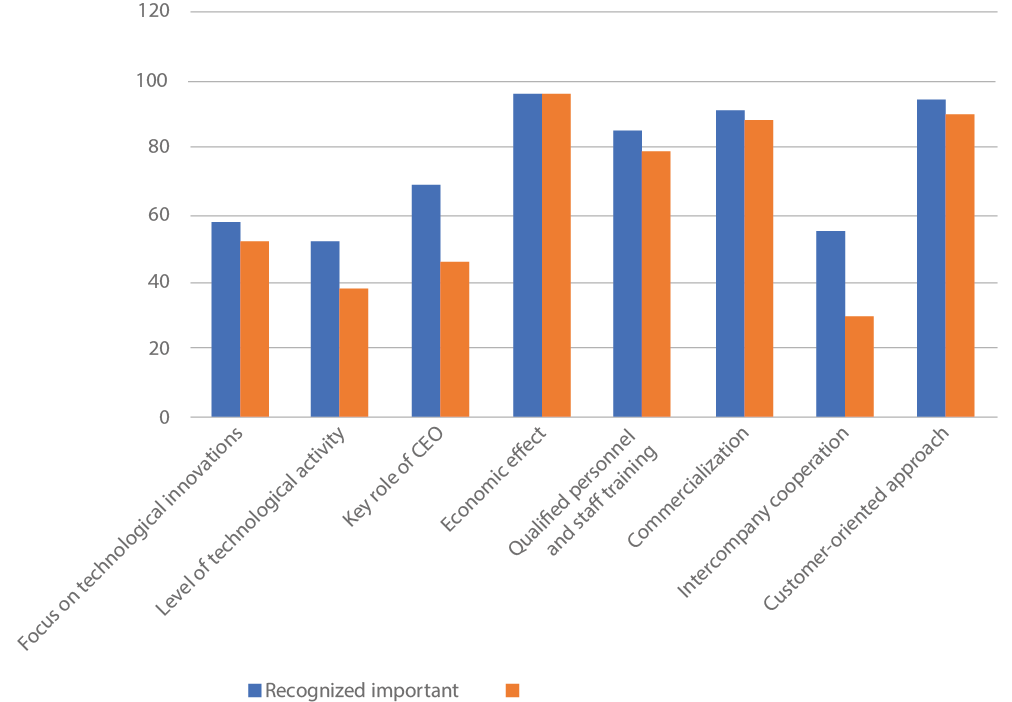
The source: сompiled by the authors.
Fig. 5. Importance and use of innovation performance metrics for simulators
The source: сompiled by the authors.
Table 8
Top 7 metrics of innovation efficiency used by Russian industrial companies
|
Innovation metrics |
Frequencies of mention (%) |
||||
|
Radical innovators |
Technological innovators |
Effective producers |
Creators of value innovations |
Simulators |
|
|
Share of new products in total sales revenue |
94 |
89 |
83 |
76 |
59 |
|
Share of revenue from sales of new products |
89 |
91 |
78 |
62 |
53 |
|
Margin of new products |
61 |
54 |
69 |
81 |
77 |
|
Created objects of intellectual property |
65 |
77 |
51 |
7 |
11 |
|
Share of intellectual property objects implemented |
68 |
71 |
43 |
3 |
4 |
|
Sold technologies |
66 |
57 |
39 |
8 |
12 |
|
Business diversification through innovation |
32 |
41 |
37 |
28 |
25 |
The source: сompiled by the authors.
It should be noted that recently industrial companies have been paying a lot of attention to both product and process innovations, which makes it necessary to evaluate the effectiveness of such activities. At the same time, the variety of innovative activities allows companies to calculate not only the main metrics, but also more complex ones.
It is important to note that when distributing metrics into groups, some indicators, depending on the purpose of application, can be attributed to other groups. For example, the metric "Costs for the development of a new product" can be attributed both to the level of innovative activity and to its effectiveness.
Frequency analysis showed that seven metrics are used by more than 50% of companies, the remaining metrics are used by no more than 15% of companies.
In addition, the importance of certain metrics depends on what type of innovative behavior the company adheres to (Table 8).
In most cases, industrial companies use well-studied standard metrics, adapting them in accordance with the goals set in the innovation strategy, that is, in accordance with innovative behavior. At the same time, about 10% of companies use unique, specially designed innovation metrics. Most of these companies belonged to the type of innovative behavior "technological and radical innovator". Also, for companies of these types, non-financial metrics for assessing the effectiveness of innovation activity turned out to be more significant than financial ones. For companies of the other three innovative types of behavior, financial metrics are more significant. Among leading and lagging indicators, the second ones are used to a greater extent, allowing to judge the achievement of goals for a certain period of time.
In most cases, the recognition of a metric as important entails its use to assess the effectiveness of innovative activities. However, this trend is not typical for all indicators.
For example, during the interviews, metrics reflecting collaboration in innovation activities were recognized as important (especially by companies classified as technological innovators and efficient producers), but subsequently they were rarely used to assess the effectiveness of innovation activities.
You can also notice that the more innovative activity is developed in a company, the more unique metrics are used to evaluate its performance.
The study showed that despite the universality of innovation activity metrics they are used in accordance with the objectives of the innovation strategy and the type of innovative behavior of an industrial company. In addition, the study showed the importance of the metric perception by the head of a company, since the majority use those metrics that are perceived by the head as the most significant. More often, financial metrics and lagging metrics are used to assess the achievement of goals over a certain period of time.
Based on the results of this study, it can be assumed that raising the awareness of managers about the balance of financial and non-financial indicators will increase the actual use of these indicators.
Since well-studied standard metrics were used more often, conducting trainings, seminars or discussion panels on the use of innovation performance metrics will allow business leaders to learn more about what kind of metrics are used, increase awareness of the importance of financial and non-financial indicators for assessing the effectiveness of innovation activity.
This empirical study was qualitative, which causes its main limitation. In-depth interviews as a qualitative method of collecting information are not representative, so their results cannot be extended to the entire population of industrial companies in Russia. In addition, the industry is quite diverse, so it is not possible to determine to what extent the surveyed companies are typical and characteristic of the industry.
Thus, quantitative research on the application of innovation metrics will be a priority for further research. It is also interesting to use performance metrics for innovative projects.
1. Linder N.V. (2020). Exploring innovation modes of russian industrial companies. Strategic Decisions and Risk Management, 11(3): 272-285. https://doi.org/10.17747/2618-947X-2020-3-272-285. (In Russ.)
2. Trachuk A.V., Linder N.V. (2016). Technique of the multiple-factor assessment of innovative activity of holdings in the industry. Academic Writings of the Free Economic Society of Russia, 198(2): 298-308. (In Russ.)
3. Trachuk A.V., Linder N.V. (2019). Innovative activity of industrial enterprises: Measurement and effectiveness evaluation. Strategic Decisions and Risk Management, 10(2): 108-121. https://doi.org/10.17747/2618-947X-2019-2-108-121. (In Russ.)
4. Trachuk A., Tarasov I. (2015). The research on the efficiency of innovative activity of organizations via the process approach. Problems of Management Theory and Practice, 9: 52-61. (In Russ.)
5. Abdel-Maksound A.B. (2004). Manufacturing in the UK: Contemporary characteristics and performance indicators. Journal of Manufacturing Technology Management, 15(2): 155-171.
6. Amaratunga D., Baldry D., Sarshar M. (2001). Process improvement through performance measurement: The balanced scorecard methodology. Work Study, 50(5): 179-188.
7. Anderson N., Potocnik K., Zhou J. (2014). Innovation and creativity in organizations. Journal of Management, 40(5): 1297-1333. https://doi.org/10.1177/0149206314527128.
8. Barbosa J.P. (2004). Assessment of PR manufacturing readiness with respect to communication and information technology and its impact on productivity. University of Puerto Rico, Unpublished PhD Thesis.
9. Bremser W.G., Barsky N.P. (2004). Utilizing the balanced scorecard for R&D performance measurement. R&D Management, 34(3): 229-238.
10. Choi G., Ko S.-S. (2010). An integrated metric for R&D innovation measurement. Integration the Vlsi Journal.
11. Coombs R., Narandren P., Richards A. (1996). A literature-based innovation output indicator. Research Policy, 25: 403-413.
12. Cox R.F., Issa R.R.A., Ahrens D. (2003). Management’s perception of key performance indicators for construction. Journal of Construction Engineering and Management, 129(2): 142-151.
13. Fischer T.M., Möller K., Schultze W. (2015). Controlling: Grundlagen, Instrumente und Entwicklungsperspektiven (2, Šuberarbeitete Auflage). Stuttgart, Schäffer-Poeschel Verlag.
14. Fuchs W. (2014). Innovation und Motivation - das Gewinner-Tandem: Ideenfindung als Unternehmensphilosophie. München: mi-Wirtschaftsbuch.
15. Glassman B. (2009). Metrics for idea generation. https://www.creativejeffrey.com/creative/White_Paper_Metrics_for_Idea_Generation_Glassman_2009.pdf.
16. Goffin K., Mitchell R. (2010). Innovation management: Strategy and implementation using the pentathlon framework (2nd ed.). Basingstoke, Palgrave Macmillan. https://doi.org/10.1007/978-1-137-04752-6
17. Gupta P. (2007). Firm specific measures of innovation. Chicago.
18. Dennis P. (2003). What if your feaf plan isn't working? Canadian Machinery and Metalworking, 98(4): 39.
19. Hudson M., Smart A., Bourne M. (2001). Theory and practice in SME performance measurement systems. International Journal of Operations & Production Management, 21(8): 1096-1115.
20. Hauschildt J., Salomo S. (2007). Innovationsmanagement (4., überarb., erg. und aktualisierte Aufl.). Vahlens Handbücher der Wirtschafts- und Sozialwissenschaften. München, Vahlen.
21. Innovety (2014). Innovety LLC - Innovation management and operations excellence > Services > Innovation readiness assessments. http://www.innovety.com/site/Services/InnovationReadinessAssessments.aspx.
22. Jong J.D., Kemp R., Snel C. (2001). Determinants of innovative ability: An empirical test of a causal model. Research report / [EIM, Small Business Research and Consultancy]: 0010/A. Zoetermeer: EIM, Business & Policy Research.
23. Kanji G.K., Sa’ P.M.E. (2002). Kanji’s business scorecard. Total Quality Mangement, 13(1): 13-27.
24. Kaplan R.S., Norton D.P. (1992). The balanced scoredcard-measures that drive performance. Harvard Business Review, 70(1): 71-79.
25. Kaplan R.S., Norton D.P. (1993). Using the balanced scorecard as a strategic management system. Harvard Business Review, 71(5): 134-148.
26. Kauffeld S., Jonas E., Grote S., Frey D., Frieling E. (2004). Innovationsklima - Konstruktion und erste psychometrische Überprüfung eines Messinstrumentes. Diagnostica, 50(3): 153-164. https://doi.org/10.1026/0012-1924.50.3.153
27. Kerssens van Drongelen I.C., Bilderbeek J. (1999). R&D performance measurement: More than choosing a set of metrics. R&D Management, 29(1): 35-46.
28. Klein K.J., Conn A.B., Sorra J.S. (2001). Implementing computerzied technology: An organization analysis. Journal of Applied Psychology, 86(5): 811-824.
29. Kueng P. (2000). Process performance measurement system: A tool to support process-based organizations. Total Quality Management, 11(1): 67-85.
30. Leiponen A., Helfat C.E. (2006). When does distributed innovation activity make sense? Location, decentralization, and innovation success. ETLA Discussion Papers, The Research Institute of the Finnish Economy (ETLA), 1063.
31. Littkemann J., Derfuß K. (2011). Innovationscontrolling. In: Albers S., Gassmann O. (eds.). Technologie- und Innovationsmanage-ment. Handbuch (2nd ed.). Wiesbaden, Gabler. https://doi.org/10.1007/978-3-8349-6746-6_30.
32. Lööf H., Hesmati A. (2002). Knowledge capital and performance heterogeneity: A firm-level innovation study. International Journal of Production Economics, 76(1): 61-85.
33. Maier G.W., Streicher B., Jonas E., Frey D. (2007). Innovation und Kreativität. In: Enzyklopädie der Psychologie. Göttingen [u.a.], Hogrefe, Verl. für Psychologie.
34. Mairesse J., Mohnen P.A. (2004). The importance of R&D for innovation: A reassessment using french survey data. Journal of Technology Transfer, 30(1-2): 183-197.
35. Michie J., Sheehan M. (2003). Labour market deregulation, “flexibility” and innovation. Cambridge Journal of Economics, 27(1): 123-143. https://doi.org/10.1093/cje/27.1.123.
36. Möller K., Menninger J., Robers D. (2011). Innovationscontrolling: Erfolgreiche Steuerung und Bewertung von Innovationen. Stuttgart, Schäffer-Poeschel.
37. Morris L. (2008). Innovation metrics: The innovation process and how to measure it. An InnovationLabs White Paper: 20. https://innovationlabs.com/Measuring_Innovation.pdf.
38. Norman R.G., Bahiri S. (1972). Productivity measurement and incentives. London, Butterworths.
39. Ortiz F.I., Brito E.E., Ovalles M.L. (2007). System approach for measuring innovation technology capacity in developing countries. In: PICMET’07-2007 Portland International Conference on Management of Engineering & Technology. Portland International Conference on Management of Engineering & Technology: 611-616.
40. Pappas R.A., Remer D.S. (1985). Measuring R&D Productivity. Research Management, 28(3): 15-22. https://doi.org/10.1080/00345334.1985.11756896.
41. Rammer C., Crass D., Doherr T. et al. (2016). Innovationsverhaltender deutschen Wirtschaft: Indikatorenbericht zur Innovationserhebung 2015. Mannheim, ZEW.
42. Salomo S., Talke K., Strecker N. (2008). Innovation field orientation and its effect on innovativeness and firm performance. Journal of Product Innovation Management, 25(6): 560-576.
43. Savioz P., Blum M. (2002). Strategic forecast tool for SMEs: How the opportunity landscape interacts with business strategy to anticipate technological trends. Technovation, 22(2): 91-100.
44. Shiba S., Graham A., Walden D. (1993). New American TQM. Portland, Oregon Productivity Press.
45. Sood А., Tellis G.J. (2009). Innovation does pay off - if you measure correctly. Research Technology Management, Aug.: 13-16.
46. Tidd J., Bessant J.R. (2014). Strategic innovation management. Chichester, West Sussex, Wiley.
47. Trachuk A.V., Linder N.V. (2019). Innovations and their industrial classifications: approach to building a new typology. Strategic Decisions and Risk Management, 10(4): 296-305.
48. Choi G., Ko S.-S. (2010). An integrated metric for R&D innovation measurement. Integration the Vlsi Journal.
49. Verhaeghe A., Kfir R. (2002). Managing innovation in a knowledge intensive technology organisation. R&D Manage, 32(5): 409-417.
50. Bremser W.G., Barsky N.P. (2004). Utilizing the balanced scorecard for R&D performance measurement. R&D Management, 34(3): 229-238.
51. Vahs D., Brem A. (2015). Innovations management: Von der Idee zur erfolgreichen Vermarktung (5., überarbeitete Auflage). Stuttgart, Schäffer-Poeschel.
52. Warschat J. (2005). Der Weg zur Innovationsexzellenz: Vorlesungsunterlage. Stuttgart.
53. Žižlavský O. (2016). The use of finanical and nonfinancial measures within innovation mangament controll: Experience and research. Economics and Sociology, 9(4): 41-65. https://doi.org/10.14254/2071-789X.2016/9-4/3.
Doctor of economics, professor, dean of faculty “Higher School of Management”, Financial University under the Government of the Russian Federation, General Director of “Goznak” JSC (Moscow, Russia). ORCID ID: 0000-0003-2188-7192. Research interests: strategy and management of the companyʼs development, innovation, entrepreneurship and modern business models in the financial and real sectors of the economy, dynamics and development of e-business, operating experience and prospects for the development of natural monopolies.
Doctor of economics, professor, head of Department of Management and Innovations, deputy dean of faculty “Higher School of Management”, Financial University under the Government of the Russian Federation (Moscow, Russia). ORCID ID: 0000-0002-4724-2344. Research interests: strategy and development management companies, formation of development strategy of industrial companies in the context of the fourth industrial revolution, innovation transformation of business models, dynamics and development of e-business development strategies of companies in the energy sector in the fourth industrial revolution, exit strategies of Russian companies on international markets.
Trachuk A.V., Linder N.V. KEY INDICATORS OF INNOVATION PERFORMANCE: PERCEPTION OF SIGNIFICANCE AND PRACTICAL APPLICATION. Strategic decisions and risk management. 2021;12(4):284-298. https://doi.org/10.17747/2618-947X-2021-4-284-298
Ligovsky av 73, of.401, Saint Petersburg, 190040, Russia
Tel.: +7 (812) 346-50-15 (16)
Real Economy Publishing House.
E-mail: info@jsdrm.ru
Registration certificate PI No. FS-77 - 72389 from 02.28.2018, issued by the Federal Service for Supervision in the Sphere of Communications, Information Technologies and Mass Communications.
Processing of personal data


