


Contents
Scroll to:
https://doi.org/10.17747/2618-947X-2021-3-212-219
Scroll to:
Today, digital transformation has become a strategic development priority for many advanced industries, including transportation. There are high expectations for cost reduction, increased product quality consistency, and improved manageability of production as a whole. However, the optimistic expectations of many executives do not take into account the changing industry risks that can seriously affect the outcome of digitalization.
The purpose of this article is to investigate the impact of the digitalization process of transport on related industry risks. The theoretical basis of the article is universal organizational science of A. Bogdanov. The object of the study is freight transport.
The article argues that industry risks can be classified into three subrisks: subrisks associated with industry technology; subrisks of coordination of interests of participants in the transport process; subrisks of the transporter to manage the long-term behavior of freighters and consignees. Quantitative models characterizing each of these subrisks are proposed.
This approach is tested with three examples: The Northern Sea Route, railway transport in Russia, and the sea route from South-East Asia to Europe. The actual subrisk and the quantitative level for each of these objects are determined.
It is stated that a radical change in the level of risk is possible primarily with the help of digital technology. At the same time, digitalization gives rise to fundamentally new risks, the main of which is the risk of exhausting the differences that have caused macroeconomic flows till now.
This article is a logical continuation of the article written by the authors I. Anokhov and O. Rimskaya “Digital twins and their application in transport economy”, published in № 2.2021 in the journal “Strategic decisions and risk management”.
Anokhov I.V., Rimskaya O.N. THE IMPACT OF DIGITALIZATION ON INDUSTRY RISKS (EXEMPLIFIED BY TRANSPORT). Strategic decisions and risk management. 2021;12(3):212-229. https://doi.org/10.17747/2618-947X-2021-3-212-219
As you know, risk and profit are among the key characteristics of any economic activity and are directly dependent. As a result, the assessment of the risk level fundamentally affects the strategic decisions of individual entities and the state of the market as a whole.
Industry risks are in the focus of medium and large enterprises capable of planning their activities in the medium and long-term perspective. At the same time, approaches to the analysis of industry risks differ significantly.
You can often find the assessment of industry risk using weighting parameters set by one or another expert. However, in our opinion, the extreme subjectivity of this approach makes it ineffective.
A quantitative approach to the analysis of industry risks may seem less subjective, for example, through ranking human factors based on their interdependence [Carpitella et al., 2018. P. 12], compiling a risk matrix [Sun et al., 2017], Bayesian network analysis [Ko , Han, 2015], etc. Models of this kind are focused on the analysis of personnel behavior [Aliabadi et al., 2018] and remain “subjective in determining the likelihood and consequences of a security risk” [Guoa et al., 2021].
Another popular approach to assess industry risk is to judge the level of risk based on the company’s public reporting [Murygin, Zhulanov, 2019]. This approach, perhaps, reduces uncertainty in one aspect - in the industry, but at the same time increases it in another, corporate aspect, since the reliability of public reporting is far from always obvious.
In general, these main approaches, in our opinion, do not consider the industry as a completely specific object of study and apply standard tools to industry risks: direct judgment, expert systems, code optimization, sensitivity analysis, probabilistic analysis, Monte Carlo modeling, kinetic tree analysis, expected cash value, risk-adjusted discount rate, and risk premium [Hwang, Chen, 2015. P. 219].
Meanwhile, attention should be paid to the fact that industry risks are not concentrated within a particular organization – their fundamental feature is an interorganizational, intersubjective nature. Perhaps, this is especially noticeable in the transport industry, which connects many local markets and directly depends on their current state.
In terms of "Tectology" by A.A. Bogdanov, this or that branch is an organized complex, understood by him as “the whole is greater than the sum of its parts”. Because of this, industry risk is a completely separate type of risk, namely, the risk of maintaining a single whole.
Based on "Tectology", we can say that the reason for the appearance of such a "whole" is the difference: "Our world is generally a world of differences; only differences in energy voltages are manifested in action, only these differences are of practical importance. When activities and resistances collide, the practical amount embodied in real results depends on the way the two are combined; and for the whole, this sum increases on the side with more proportioned or "harmonious" connection and contains fewer "contradictions". This means a higher level of organization” [Bogdanov, 1989. p. 117].
If these voltages of energy differ significantly, then the difference in their potentials allows you to overcome the resistance of the external environment and gives start to flows between them: material, informational, labor and energy. Using natural scientific terminology, we can say that flows arise between two poles that have opposite charges of such a degree of difference that allows you to overcome the resistance of the surrounding space. Under the closure of the differences, a qualitatively new unified whole arises, the condition for the existence of which is the continuous circulation of flows.
From this point of view, any sectoral organized complex is generated by macroeconomic differences and is in demand only if it facilitates the passage and integration of certain flows. This is most clearly seen in the example of transport, which is designed to level natural resistance to cargo flows by leveling the landscape (that is, by creating roads, canals, bridges, etc.), arranging a supply and repair system, warehouses, loading and unloading points, etc.
Accordingly, the industry as a whole is characterized by its own specific types of risks which can be divided into three types:
From an economic point of view, these risks can be expressed in terms of the marginal costs of the exporter (MCexp), the competing seller in the local finished product market (MCloc) and the transport carrier (MCtrans). A stable trade between the poles occurs if the sum of MCexp and MCtrans is significantly lower than MCloc, otherwise, any trade is inappropriate, i.e.:
MCexp + MCtrans < MCloc. (1)
Accordingly, any transport movement of goods will be carried out only if inequality (1) is satisfied.
Inequality (1) shows the condition for the minimum technological and economic feasibility of carrying out cargo transportation for the local market. However, for regular transportation, the necessary conditions must be supplemented by sufficient conditions, that is, the minimum necessary technological and economic feasibility must be supplemented by a sufficient amount of revenue per unit of cargo. This question concerns the second type of risks.
Pexp + Ptrans << Ploc. (2)
In other words, this type of risk reflects the cost feasibility of the transportation process, which is a consequence of the coordination of the interests of all market participants and their requests in the form of prices for their products and tariffs for services.
MPrtrans > MPrexp + MPrloc. (3)
We can depict the considered stages with the help of the corresponding curves (Fig. 1).
Fig. 1a shows the carrier's ability to manage its own costs and market price. Long-term average total cost of the carrier (LATC – longtime average total cost) shows a positive effect of scale and decreases with an increase in traffic. Fig. 1b shows that the exporter and the carrier can only work together effectively, that is, provide the marginal cost of the goods in a smaller amount than that of a local competitor.
At stage I (see Figure 1), the carrier manages to lower marginal cost at the same time as freight traffic increases, but the LATC value is much higher than the price level. Only upon reaching the volume Q1 the transportation activity becomes break-even:
MCexp + MCtrans = MCloc. (4)
At stage II (in section Q1Q2), the carrier achieves highly profitable activities, since there is a maximum difference between the sum of the marginal costs of the exporter and the carrier, on the one hand, and the price level in the consumer market, on the other hand. In addition, the difference between the sum (MCexp + MCtrans) and MCloc is maximum in this section.
At stage III, the carrier's marginal cost begins to rise rapidly (Fig. 1a), but control over freight rates allows this increase to be offset by a controlled increase in the market price. The dotted segment P* shows the situation when the carrier manages to increase the tariffs for its services by controlling the activities of the participants in the transportation process. As a result, despite the increase in marginal costs, his profit does not decrease. In other words, the increasing marginal cost in this case is passed on to the final consumer.
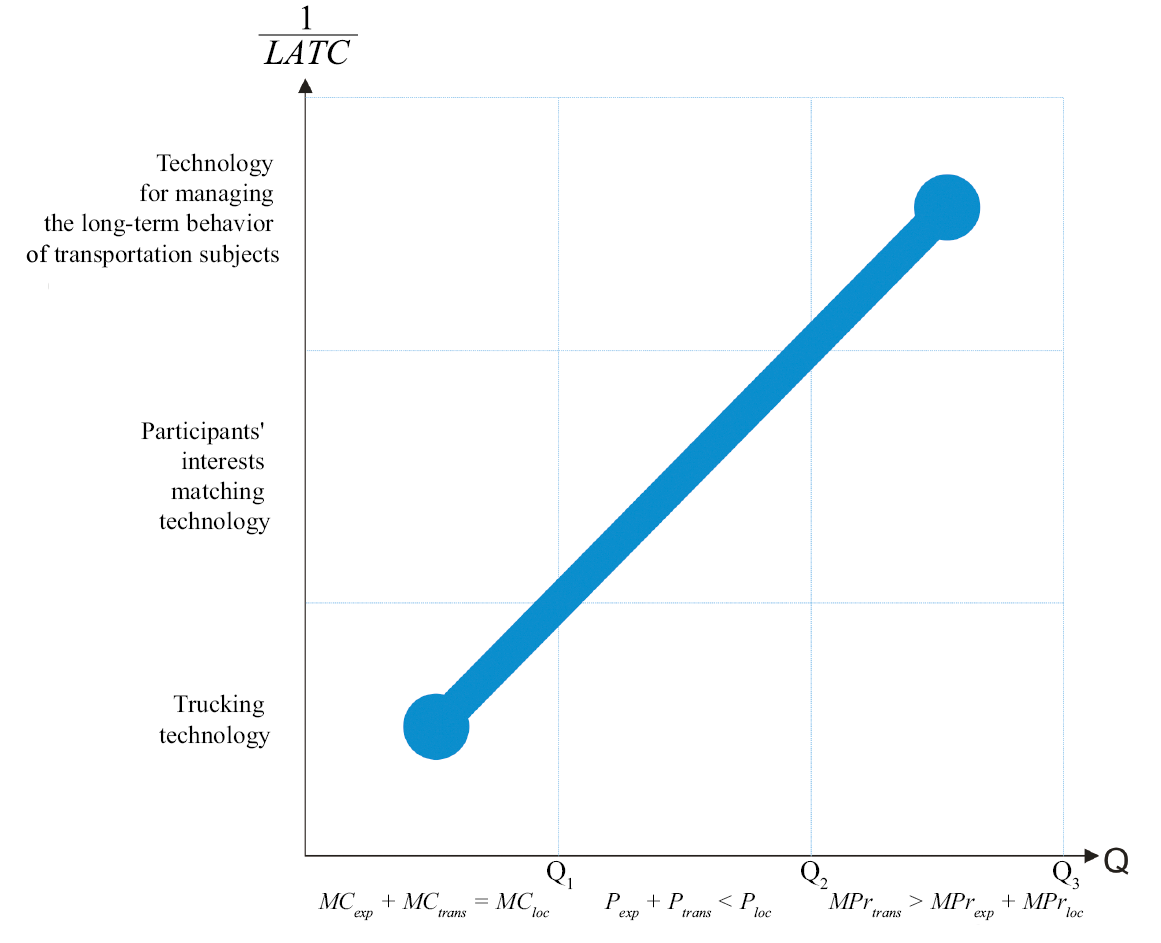
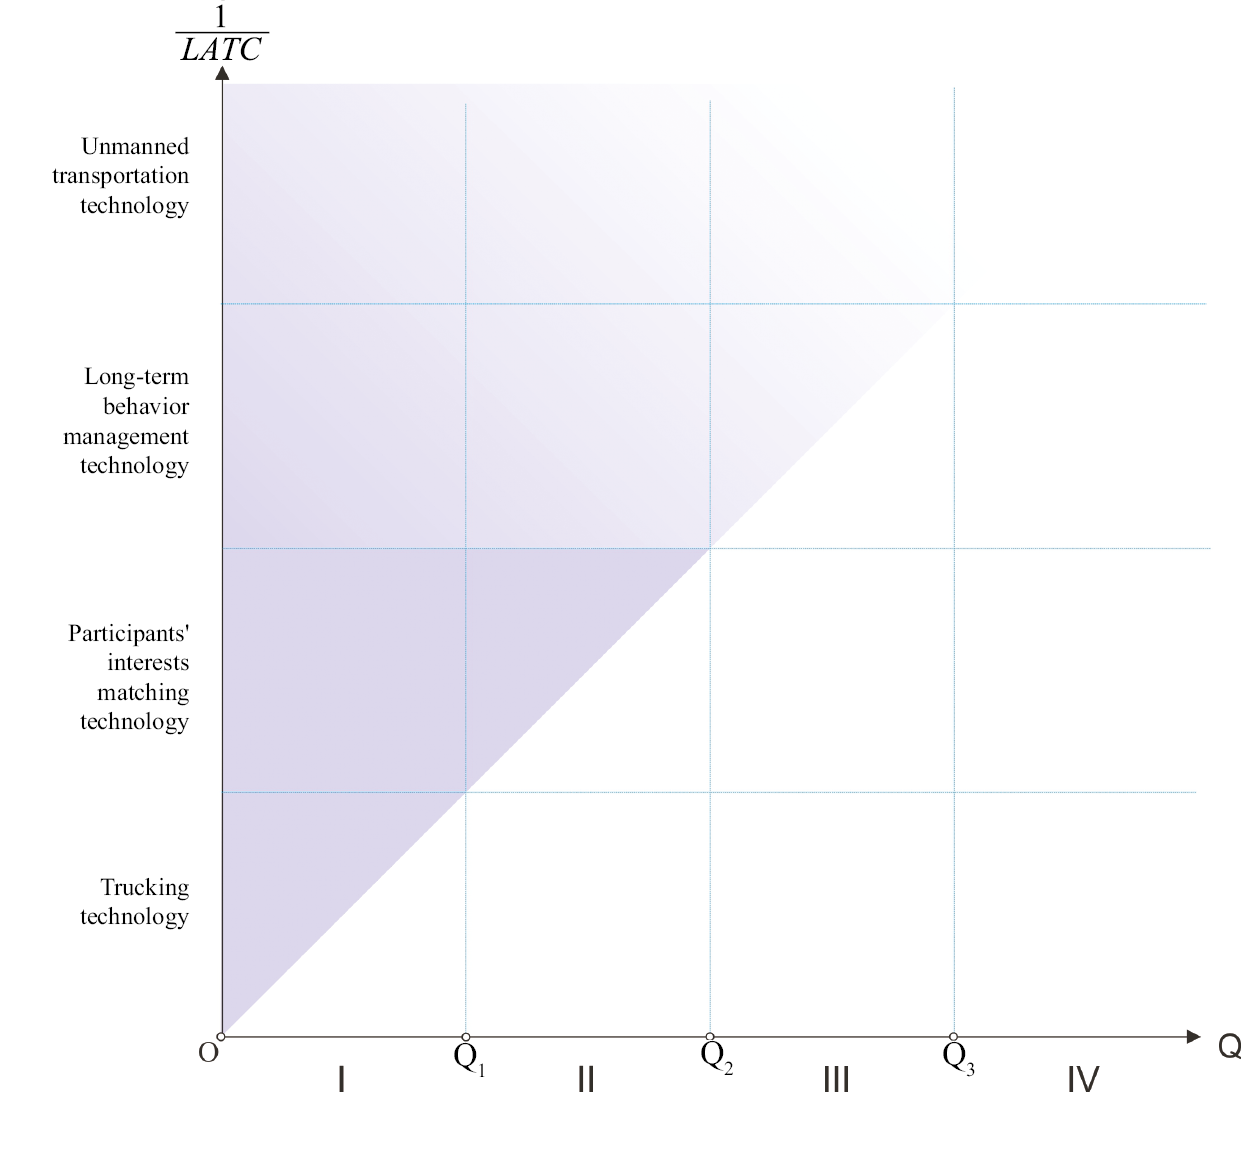
Based on the foregoing, with effective management of marginal costs, the price and the behavior of other actors, the carrier derives maximum benefits from the positive economies of scale, mastering all new technologies, increasing its competitiveness and the volume of cargo transportation. At the same time, he consistently moves from internal risks to regional, and then to global ones, which corresponds to the stages of transportation process technologies development and new technological structures [Ivanov, 2020]. This can be represented in the form of a graph (Fig. 2).
For convenience, the positive effect of scale on the graph is shown along the y-axis through the ratio , which makes it possible to visualize the unidirectional change in the cost and volume of transportation.
At the first stage (in the section from 0 to Q1 in Fig. 2), the technology of physical transportation is being developed in order to make it competitive for the delivery market, primarily in terms of costs. An example of this stage can be the transportation of liquefied gas and oil in tankers: despite the technical and technological sophistication of this process, the marginal costs of exporters often exceed the marginal costs of alternative delivery methods (primarily pipeline transport), that is, there is an inequality MCexp + MCtrans > MCloc.
If the issue of technological and economic feasibility of transportation is resolved, then at the second stage (section Q1Q2 in Fig. 2) the issue of its price feasibility is resolved. It is necessary to work out financial technologies, so that the interests of all participants in the transportation process are coordinated and the sale price of the finished product on the local market makes the activities of the exporter and the transport company more attractive than the alternative types of business activities available to them. In economics, this is denoted by the concept of "normal profit" - this is the amount of profit that is able to keep the entrepreneur in his field of activity. Examples of the successful implementation of this task can be found both in history and in modern times: the supply of ancient Rome with grain from Egypt, the export of spices from the Malacca Strait, the export of goods from modern China to Europe and America, etc. In all these cases, the price level in the supply market was so high that it covered all types of risks and made other types of entrepreneurship uninteresting, that is, the inequality Pexp + Ptrans << Ploc was fulfilled.
At the third stage (section Q2Q3 in Fig. 2), the carrier's activity becomes so effective that it is able to develop its own technologies that are inaccessible to competitors, providing it with control over transport routes and long-term market dominance. Such examples include the control of railroad carriers over oil producers in the United States in the 19th century. (Standard Oil Company), modern oil and gas pipelines, man-made water canals (for example, Suez), etc. In all these cases, carriers, due to their monopoly position, are able to extract a much larger marginal profit per unit of cargo than shippers and consignees, that is, MPrtrans > > MPrexp + MPrloc.
Implementation of the balanced strategy shown in fig. 1 and 2 is possible only if the subject continuously develops technologies, is able to perceive causal relationships, has a long-term planning horizon, can take into account the interests of all transportation subjects and predict their behavior. Ultimately, it all comes down to the ability of working with data and information models, simultaneously solving a system of inequalities:
 . (5)
. (5)
All three types of inequalities must be observed simultaneously by the carrier in order to remain competitive in the market.
Fig. 1. Graphical representation of risks
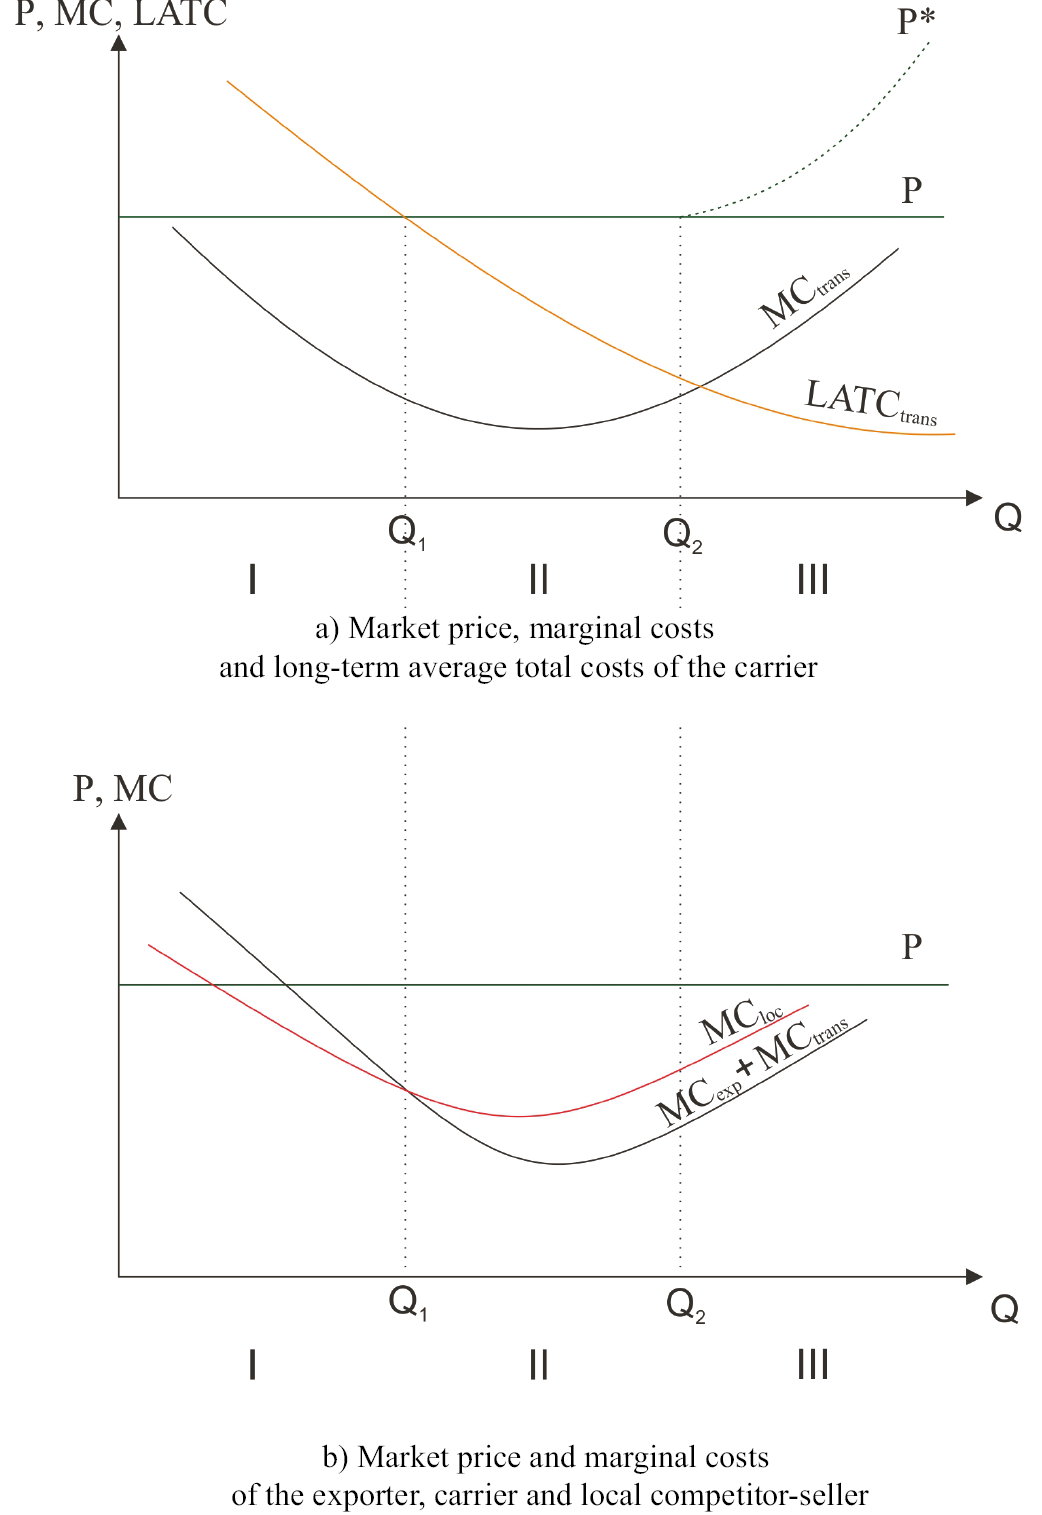
Fig. 2. Increase in the carrier’s cargo turnover and types of risks with a balanced strategy
The model presented above is based on detailed internal data of the carrier, shipper and consignee. This kind of data is not available for analysis by an external researcher, which encourages the use of proxy data. In this regard, further analysis will be based on publicly available data on transport routes showing varying degrees of efficiency: the Northern Sea Route, the Russian railway and the Southeast Asia-Europe sea route. At the same time, the analysis presented below does not claim to be absolutely accurate, but is aimed at demonstrating the very analytical approach to the issue under study.
Based on fig. 2 we will present the risk map of the carrier (Fig. 3).
Let us consider the square 0АВQ1 which shows the effectiveness of the carrier's management of its technology of cargo transportation. If the transport company develops in a balanced way (that is, the volume of traffic increases simultaneously with the decrease in LATC), then the area of the triangle 0АВ is equal to the area of the triangle 0ВQ1, and their ratio will be equal to one:
 . (6)
. (6)
If their ratio is less than one, then the transport company develops according to a rationalization model: the technology gradually improves, the cost of transportation decreases, but the volume of transportation does not change. If the ratio is greater than one, then the transport company develops according to a conservative model: the transportation technology remains the same, the cost of transportation does not change, but the volume of transportation grows due to an increase in the nominal quantity of the same rolling stock. At the same time, each deviation in one direction or another indicates a carrier's imbalance and an increase in the risks of degradation (with a conservative strategy) or the risk of being forced out of the market by a larger player (with a rationalization strategy).
Formula (6) can be denoted as a balanced risk management coefficient (Kb): if Kb = 1, then the risks of the carrier company are minimal; if Kb → ∞, then the risks of technological degradation of the carrier company increase Kb → 0, then the risks of “pupation” in its niche and the inevitable subsequent loss of control over the market increase for the carrier company.
In a similar way, the technology of matching interests risks (square 0CDQ2) and the technology of managing the behavior of other market entities risks (square 0EFQ3) can be analyzed.
As a result, the risks of a particular enterprise can be represented as a three-component indicator:
Kb = (KbI; KbII; KbIII), (7)
Where KbI – coefficient of balanced risk management of transportation technology; KbII – coefficient of balanced risk management of the technology of interests matching; KbIII – coefficient of balanced risk management of control over the long-term behavior of consignors and consignees.
Let us apply this approach to practical examples: the Northern Sea Route, the Russian railway and the sea route Southeast Asia – Europe.
The Northern Sea Route currently has increased marginal costs for both carriers and exporters for the following reasons:
The above data on the Northern Sea Route allow us to present the state of risks of this object as follows (Fig. 4a).
The volume of traffic along the Northern Sea Route is gradually increasing, but marginal costs and prime cost are inelastic, there is no decrease in LATC (Fig. 4a). As a result, there is no productive activity in the technology of matching interests and in the technology of managing the behavior of consignors and consignees.
Thus, KbI = 9 / 7 = 1.3; KbII = 0; KbIII = 0 or, using expression (7), (1.3; 0; 0).
The analysis of Russian railway transport, carried out in the article [Rimskaya, Anokhov, 2021], allows us to conclude that it has successfully overcome stages I and II (Fig. 3) and has come close to the need to master the technology of long-term management of the behavior of consignors and consignees. Based on this, it is possible to similarly build an enlarged risk map for railway transport (Fig. 4b), according to which its coefficient of balanced risk management Kb = (1; 1; 0).
The third object - the sea route Southeast Asia - Europe - has been perhaps the most important transport channel of the continent and the world for centuries, provides the most economical method of transportation, guarantees low risks, satisfies the interests of all participants in the process and determines the vital activity of many companies, industries and even states . For these reasons, it is possible to present an enlarged risk map for this path (Fig. 4c), the balanced risk management coefficient Kb = (1; 1; 1).
Fig. 3. Carrier’s risk map
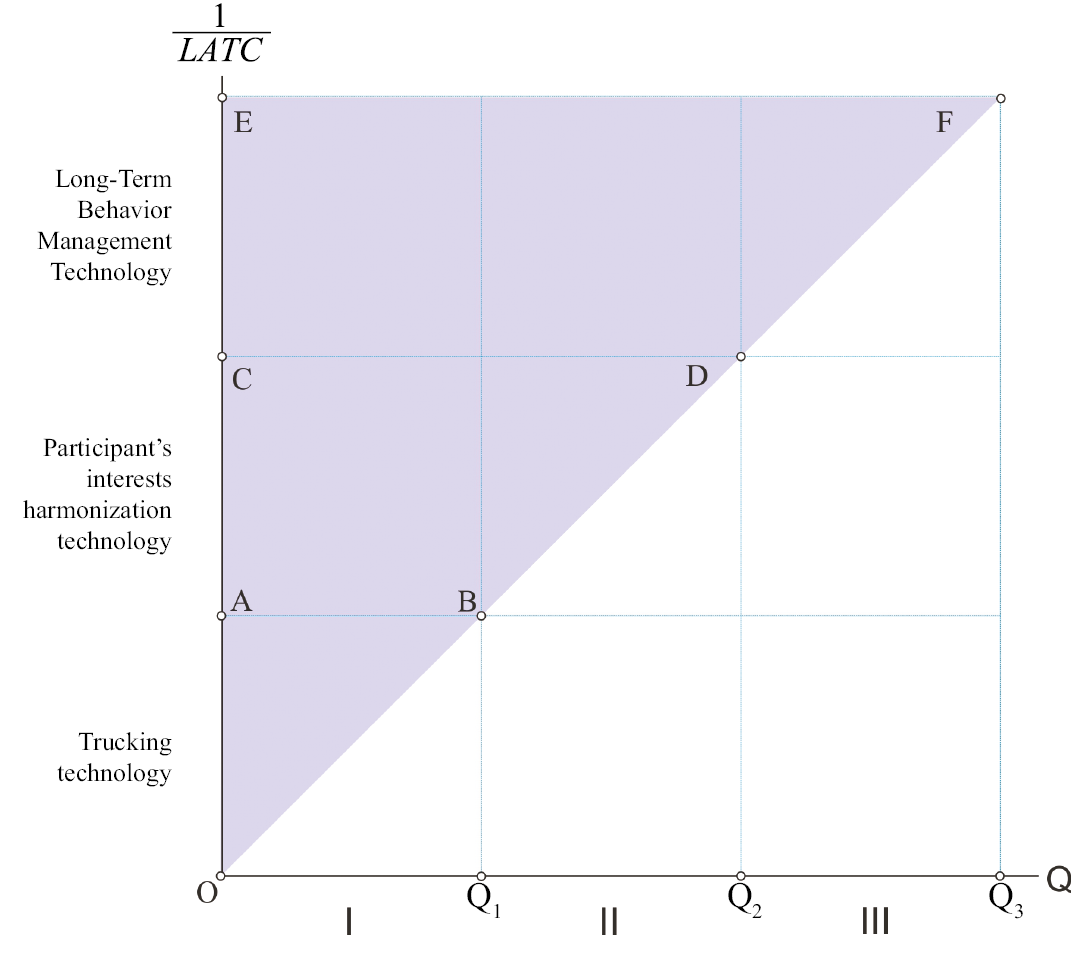
Figure 4. Situational risk maps
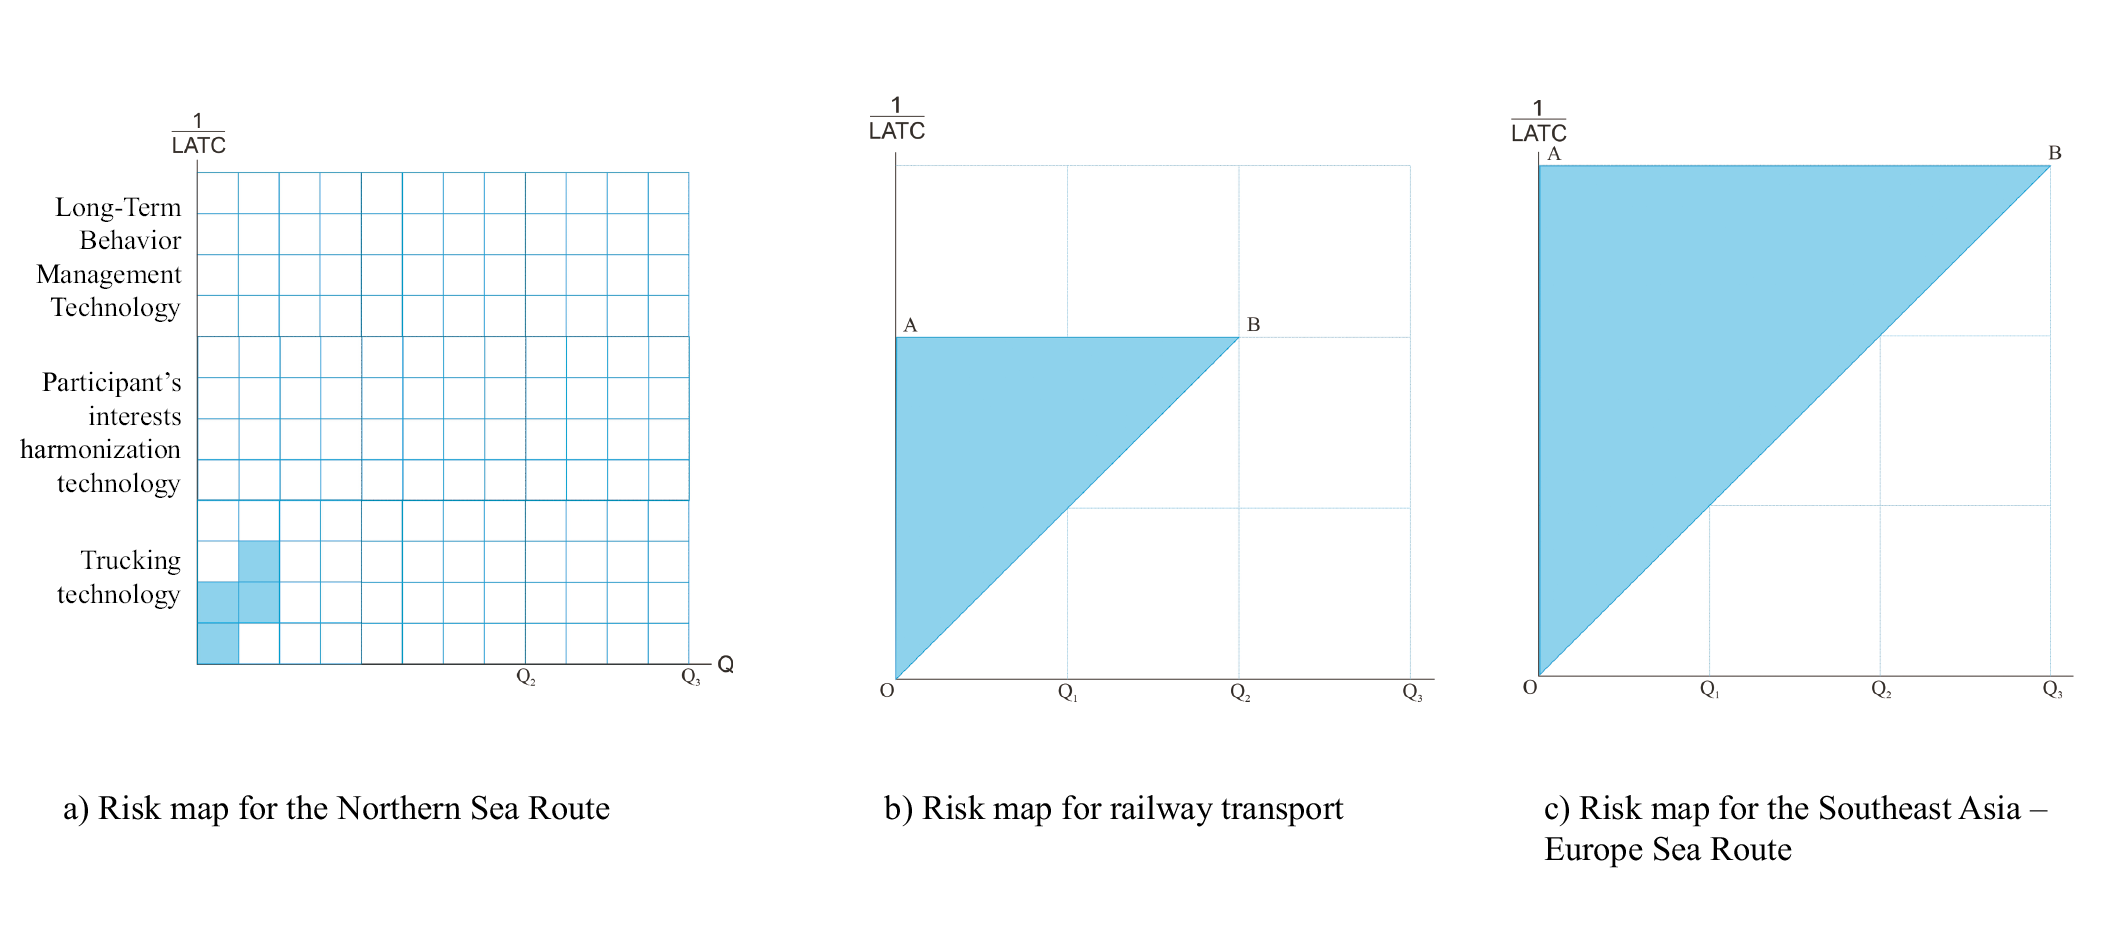
Fig. 5. Risk map with a new technological level
The above examples show that risks initially decrease as marginal cost decreases, then as LATC decreases, and finally as marginal profit increases. In turn, the reduction of marginal costs requires an increase in organization (in the understanding of Bogdanov) through the continuous improvement of technologies, which makes it possible to more effectively overcome the resistance of the external environment.
At the same time, the risk maps presented above show the current state of affairs in risk management. However, the reality of tomorrow will be totally digitalized, which will undoubtedly have a decisive impact on the nature of risks and risk management.
As already discussed by [Rimskaya, Anokhov, 2021], digitalization allows us to divide production processes into two classes:
In this respect, the digitalization of routine processes will generate another level on the risk map (Fig. 2) - the level of digital planning technology, unmanned production and transportation (Fig. 5).
This entails a new round of increasing the volume of production with a simultaneous reduction in cost, while giving rise to a radically new type of risks - the risks of human interaction with the dehumanized technosphere. Such risks would include:
However, the most important risk of the new stage will be the risk of exhausting the need for transportation as following: the more regular the routine needs are satisfied, the less significant they become for a person, the less their consumer value for him and the more willingly he switches to substitute goods and alternative goods. In other words, the consequence of digitized supplies will be the gradual displacement of absolute needs to the periphery of human consciousness, the alignment of the poles and the exhaustion of macroeconomic differences. As a result, the need for transport as such will gradually decrease.
Digitized routine processes will automatically cease to be a source of profit and the basis of competitiveness. They will remain a way to satisfy absolute needs, but will not have consumer value.
In addition, the extreme predictability of routine production processes eliminates short-term risks, but gives rise to long-term ones: the lack of human attention inevitably leads to the degradation of equipment and obsolete technologies.
Such risks are more long-term and more fundamental than their previous types. The tools for managing these qualitatively new risks will be qualitatively different from those used today. Today's risk management tools (self-insurance, hedging, diversification, reserve formation, limiting, etc.) are focused on the transfer of risks in time, space, horizontally (within the same reproduction chain) or vertically (for example, within TNCs). At the new stage, something fundamentally different happens: a zone with near-zero risks and a zone with maximum risks are distinguished.
Most likely, the following can be attributed to risk management tools in the digital economy:
The article considers sectoral transport risks and proves that they are heterogeneous, quantifiable and include three sub-types of risks: risks of physical technology, risks of matching interests, and risks of managing the long-term behavior of shippers and consignees.
Digitalization and the digital economy give rise to another category of risks before our eyes: the risks of digital planning technology, unmanned production and unmanned transportation. The search for tools to stop these risks is the task of the very near future.
1 Kornilov V. (2013). The Arctic has always attracted the attention of romantic explorers, practical industrialists, hunters and people prone to adventurism. Maritime news of Russia, 16.
1. Bogdanov A. (1989). Tectology: General organizational science. In 2 book. Book 1. Abalkin l. (ed.). Moscow, Ekonomika. (In Russ.)
2. Erochin V. (2017) The Northern sea route and Arctic transport corridors: Problems of use and forecasts of commercialization of freight traffic. Marketing and Logistics, 6(14): 22-44. (In Russ.)
3. Ivanov V. (2020) Outlines of the new world order. Philosophical Sciences, 63(5): 7-27. (In Russ.)
4. Murygin A., Zhulanov E. (2019). Methodology for assessing the impact of industry risks on the effectiveness of investment projects for the development of missed hydrocarbon deposits. Bulletin of Perm National Research Polytechnic University. Socio-Economic Sciences, 4: 275-289. (In Russ.)
5. Rimskaya O.N., Anokhov I.V. (2021). Digital twins and their appliance in transport economics. Strategic Decisions and Risk Management, 12(2): 107-194. DOI:10.17747/2618-947X-2021-2-107-194. (In Russ.)
6. Aliabadi M., Aghaei H., Kalatpour O., Soltanian A.R., Nikravesh A. (2018). Analysis of human and organizational factors that influence mining accidents based on Bayesian network. International Journal of Occupational Safety and Ergonomics, 26(4): 670-677.
7. Carpitella S., Carpitella F., Certa A., Benítez J., Izquierdo J. (2018). Managing human factors to reduce organisational risk in industry. Mathematical and Computational Applications, 23: 67. DOI:10.3390/mca23040067.
8. Guoa Sh., Lia J., Heb J., Luoa W., Chenc B. (2021). A modified risk matrix method for behavioral risk evaluation in the construction industry. Journal of Asian Architecture and Building Engineering. URL: https://doi.org/10.1080/13467581.2021.1905647.
9. Hwang B.-G., Chen M. (2015). Sustainable risk management in the construction industry: Lessons learned from the IT-industry. Technological and Economic Development of Economy, 21(2): 216-231. DOI:10.3846/20294913.2014.979455.
10. Ko Y., Han S. (2015) Development of construction performance monitoring methodology using the Bayesian probabilistic approach. Journal of Asian Architecture and Building Engineering, 14(1): 73-80. DOI:10.3130/jaabe.14.73.
11. Sun J.-W., Park K.-H., Lee M.-J. (2017) A multi-level asset management decision method considering the risk and value of bridges. Journal of Asian Architecture and Building Engineering, 16(1): 163-170. DOI:10.3130/jaabe.16.163.
Candidate of economic sciences, associate professor, chief-editor of the Scientific and Publishing Department of the Research Institute of Railway Transport (Moscow, Russian Federation). ORCID: 0000-0002-5983-2982, Researcher ID: AAF 9428 2020, SPIN: 1444-3259, AuthorID: 260787. Research interests: labor, economic interests, theory of firms, transport.
Candidate of economic sciences, associate professor, head of the Scientific and Educational Complex of the Research Institute of Railway Transport (Moscow, Russian Federation). ORCID 0000-0002-1548-0815, Researcher ID 583440, SPIN: 4185-4532, AuthorID: 583440. Research interests: world economy, digital economy, labor economics, education economics, lifelong education, European systems and models of education, human resource management, motivation and stimulation of labor, economic and political problems of the humanitarian crisis.
Anokhov I.V., Rimskaya O.N. THE IMPACT OF DIGITALIZATION ON INDUSTRY RISKS (EXEMPLIFIED BY TRANSPORT). Strategic decisions and risk management. 2021;12(3):212-229. https://doi.org/10.17747/2618-947X-2021-3-212-219
Ligovsky av 73, of.401, Saint Petersburg, 190040, Russia
Tel.: +7 (812) 346-50-15 (16)
Real Economy Publishing House.
E-mail: info@jsdrm.ru
Registration certificate PI No. FS-77 - 72389 from 02.28.2018, issued by the Federal Service for Supervision in the Sphere of Communications, Information Technologies and Mass Communications.
Processing of personal data


