


Contents
Scroll to:
https://doi.org/10.17747/2618-947X-2021-2-170-177
Scroll to:
The paper offers a look the new opportunities that open up in management in the context of the development of information technology. The aim of the study is to highlight the benefits of using technologies for collecting big data and spatial statistics for making strategic decisions in the tourism industry. In the work, using the example of the ski resort “Abzakovo”, the technologies for collecting data on the Internet are shown, the spatial dependence of the data is assessed and conclusions are drawn that allow subsequent strategic decisions as to enterprises located in this territory. So are the government bodies interested in the development of this tourist zone. Thus, the analysis of the geography of the members of the “Abzakovo” group made it possible to single out a statistically significant spatial dependence of their age, which manifests itself in the neighborhood of the older members of the group near the resort. The results of the analysis of the rating of tourist infrastructure facilities in the area of the ski resort “Abzakovo” identified spatially related zones of low and high ratings.
Lakman I.A., Timiryanova V.M. STRATEGIC DECISIONS IN THE TOURISM INDUSTRY BASED ON INTERNET DATA COLLECTION TECHNOLOGIES AND THEIR SPATIAL ANALYSIS. Strategic decisions and risk management. 2021;12(2):170-177. https://doi.org/10.17747/2618-947X-2021-2-170-177
“The flow of huge amounts of information from various structures containing knowledge of enormous value is growing at a high speed” [Shvedov, 2017]. In a competitive environment, the one that has the most complete information wins, hence, there is an ongoing process of searching for tools to collect and process emerging data. This applies to all industries and areas of activity, including the tourism industry.
The tourism industry is one of the most actively developing sectors of the world economy [Butenko, 2015]. Its development has an impact not only on the objects of tourist infrastructure, but also indirectly affects the transport sector, construction, light and food industries. Accordingly, both the owners of tourist infrastructure facilities and the authorities are interested in the development of tourism, since it has a positive effect on the inflow of funds, the development of the territory and its investment attractiveness.
The importance of this industry determines the interest for the research into the factors of its development. In the context of the evolution of big data, open data is attracting more and more research interest. Basically, these are reviews and ratings left by tourists on the Internet. The range of data sources, as well as the scope of research that use this information, is quite wide [Alaei et al., 2017; Bulgakov, 2018; Pigareva, Shevelev, 2018; Li et al., 2018; Ćurlin et al., 2019; Dombrovskaya, 2020; Chang et al., 2020]. The collected data is most often used for semantic analysis of texts, including identification of key points that are most important for clients [Alaei et al., 2017; Ćurlin et al., 2019], or “tonality of posts” [Bulgakov, 2018]. In some cases, the results are visualized on maps [Adhinugroho et al., 2020; Chang et al., 2020]. However, there are very few studies providing a spatial analysis of these data, despite the fact that the modern development of technologies implies their geographical structuring. Moreover, Russia as a whole is characterized by their absence in relation to any research in the tourism industry. So, S.A. Tarkhov notes that research in Russia is reduced “not even to an analysis of the location of tourism, but to the study of the influence of various factors on the characteristics of tourism in a particular region or country” [Tarkhov, 2019], that is, they do not involve the use of spatial statistics tools.
At the same time, foreign literature deals with a rather wide range of issues which use these tools and models. For example, W. Lee, L. Pennington-Gray and J. Kim studied the impact of proximity to the beach, city center and airport on food safety in 308 hotel restaurants using geographically weighted regression [Lee et al., 2019]. M. Salas-Olmedo and the co-authors studied the spatial autocorrelation of tourism activity based on 234,159 tweets, compared them with the information obtained from the open data sources Panoramio and Foursquare [Salas-Olmedo et al., 2018]. S. Zhang, G. Zhang and H. Yu assessed the spatial patterns of tourism development in the Yellow River Basin in terms of the number of tourists (domestic and inbound) and tourism revenues (domestic and inbound) at the provincial and prefectural levels [Zhang et al., 2020]. In general, the list of such works can be quite wide, as well as the range of directions for using the obtained results.
In the case of businesses, this information allows them to make decisions on their business development, from simple marketing plans that take into account the geographical organization of customers, to the formation of expansion directions that involve the competitive environment and the hierarchy of tourist destinations.
If we talk about the state, then here the range of focus areas is also wide: ensuring security and developing recommendations for organizing activities near objects of attraction for the population (natural, cultural, etc.), creating infrastructure, attracting investments for the development of territories, etc. The connection of the results with the spatial location of the objects that form them is obvious, and its precise quantitative assessment in a specific situation allows you to make informed decisions.
The purpose of the study is to highlight the benefits of using big data collection technologies and spatial statistics to make strategic decisions in the tourism industry. To achieve this goal, the following tasks were solved: the review of data collection and spatial analysis tools, collection and evaluation of data from VK.ru and Google.com sites on the example of the Abzakovo ski resort, as well as generalization of the obtained results.
The tools used in this study can be divided into two groups: the first includes tools for collecting and structuring data, the second - analysis tools.
The collection of initial information often takes up the lion's share of the total time spent on research. When it comes to micro-level analysis (for example, about the operation of individual enterprises, about customer relationships), collecting information from external sources involves field research. Especially time-consuming is the survey required to understand the various behavioral patterns. At the same time, in the context of information technology development, when the population leaves data about themselves on the Internet and somehow evaluates the activities of enterprises, a number of questions can be answered even without this time-consuming method of data collection. The range of open data is quite wide, therefore, “with the development of information technology, more massive databases appear on Internet portals and sites, as well as tools (so-called parsers) to form samples with specified characteristics based on Internet data” [Trifonov et al., 2020]. It is this tool, that was used in this work to collect data.
Parsing is defined as “automated collection of unstructured information, its transformation and presentation in a structured form” [Seliverstov et al., 2019]. “Parsing technologies allow to extract a large amount of actual data which is processed by data mining tools” [Dneprovskaya, 2020]. This tool has been actively used in Russia for the last five years, while in a number of foreign countries the results of its use were reflected in scientific works twenty years ago [Piccoli, 2001]. In general, it has a rather wide range of applications. In particular, it made possible to collect data for modeling the market value of a car based on car sales announcements [Trifonov et al., 2020], assessing the state of transport routes in the Northwestern Federal District of Russia [Seliverstov et al.
applicants [Plotnikov, 2016] and electronic public procurement data [Tsyganova et al., 2020]. In the tourist sector, this collection method has been used to analyze hotel visitor reviews on Tripadvisor [Chang et al., 2020], traveler tweets [Alaei et al., 2017; Ćurlin et al., 2019], VKontakte [Dombrovskaya, 2020], Facebook [Bulgakov, 2018], Instagram [Pigareva, Shevelev, 2018], Yahoo
[Li et al., 2018], etc.
For parsing, as a rule, specialized programs are used, as well as various libraries for Phyton and R packages. It should be borne in mind that large sites owing big data in demand provide access to it through the API1. In these cases, as a rule, their own specialized libraries are formed for each of them. In particular, within the framework of this study, the vkR, googleway libraries were used, and it was also required to connect the corresponding APIs, since both the VKontakte social network and the Google search engine have a clearly regulated set of ready-made classes, functions or structures for working with the available data. It should be noted, that the collection of data from sites as a whole does not break the law, if the owner of the site does not prohibit it in the robots.txt license, as, for example, in the social networks Facebook and Instagram, as well as in the Yandex search network. And if in Yandex the possibility of parsing is allowed in case of obtaining a license, including a commercial one, then Facebook currently strictly adheres to the policy of protecting users' personal data from any processing. The social network VKontakte also has restrictions on the collection, which are prescribed in the rules of the platform (clause 2), in some cases requiring consent from the site administration.
As part of this study, an analysis of the Abzakovo ski resort was made. It is located in the Ural tourist zone under construction on the territory of the Republic of Bashkortostan. In order to identify the spatial features associated with this resort, the Abzakovo group on the social network VKontakte2, was analyzed, as well as the ratings of catering facilities and the location of the ski center in Google maps. Data collection was carried out in April, 2021.
The Abzakovo group in the social network VKontakte at the time of data collection consisted of 36,755 people, among which 54.6% indicated their affiliation to the female gender, and 19 people did not indicate or concealed their gender. 54.3% of all participants noted the city of their residence, 21.4% – the year of their birth. The absence of data on a number of participants is determined by the privacy settings they use, ranging from “all users see” to “only me”. The geography of the group members is very wide, going beyond the borders of Russia. There are participants who marked their location in Abu Dhabi, Leon, London, etc. The analysis of the age of the group members was carried out only on 7802 observations in Russia (Fig. 1).
It should be agreed that the reliability of these data is difficult to verify, and this should be taken into account in the analysis [Salas-Olmedo et al., 2018; Dombrovskaya, 2020]. Returning to the age of the group members, we cannot exclude the possibility that some of them overestimated their age due to age restrictions when registering on the VKontakte social network, some of the participants could underestimate their age or indicate the wrong date for some reason.
The data on 23 tourist infrastructure objects were taken from Google maps, including seven cafes, one restaurant, one canteen, fourteen hotels and holiday homes located in close proximity to the ski center in the villages of Abzakovo and Novoabzakovo, as well as on the P316 highway leading to Beloretsk (Fig. 2).
Data analysis was carried out by the most well-known method of spatial statistics and included the estimation of local Moran indices (LISA – Local Index Spatial Autocorrelation) [Moran, 1948; Anselin et al., 2002]:
 (1)
(1)
where x ̅ is the average value of the indicator, wij is the spatial matrix, N is the number of units under study.
To analyze the spatial distribution of members of the VKontakte social network group and to analyze the ratings of infrastructure facilities, different matrices (wij), were used, taking into account the proximity of the i-th and j-observation objects. In the case of infrastructure ratings analysis, a simple first-order neighborhood matrix was used, built according to the queen criterion. In the case of the analysis of members of the social group VKontakte, a distance matrix with a radius of 0.4°. was used. The use of other types of matrices in the second case was impossible due to the nature of the data. Thus, the presence of cities with individual participants made it inappropriate to use a matrix of the type k – nearest neighbors, since in this case observations from other cities located at a sufficiently large distance could be taken into account as neighbors. In the cities with a significant number of participants, the neighborhood matrix, as well as the matrix of type k – nearest neighbors, did not allow us to cover the entire set of relationships that possibly exist between observations within the city.
When interpreting the results of calculating the local Moran's index, both the sign and the obtained value are important. At LImi < 0 there is a negative spatial autocorrelation, that is, the object of observation differs significantly from its neighbors (outlier) by this value. For LImi > 0
the spatial autocorrelation is positive, that is, this observation is similar to the neighboring ones (cluster) in this value. Based on the values of the local Moran's index and their statistical significance, cluster cores can be identified.
The geography of the group members is shown in fig. 3. It should be noted that more than 70% of observations - group members live in the South Urals, that is, in the immediate vicinity of the ski resort. Most of the group members live in the city of Magnitogorsk (1271 observations, or 16.3%), the next city is Ufa (952 people, or 12.2% of the surveyed participants).
The assessment of the local Moran's index showed that there is a certain (significant at p < 0.05) spatial relationship of observations, which makes it possible to identify individual cities (Fig. 3). Areas are in red, where observations with higher values of the indicator are adjacent to observations that also have relatively higher values of the indicator. With regard to the analyzed indicator “year of birth”, we can say that in the zones in red, young members of the group predominate, and in the zones in blue, older people coexist with relatively aged people.
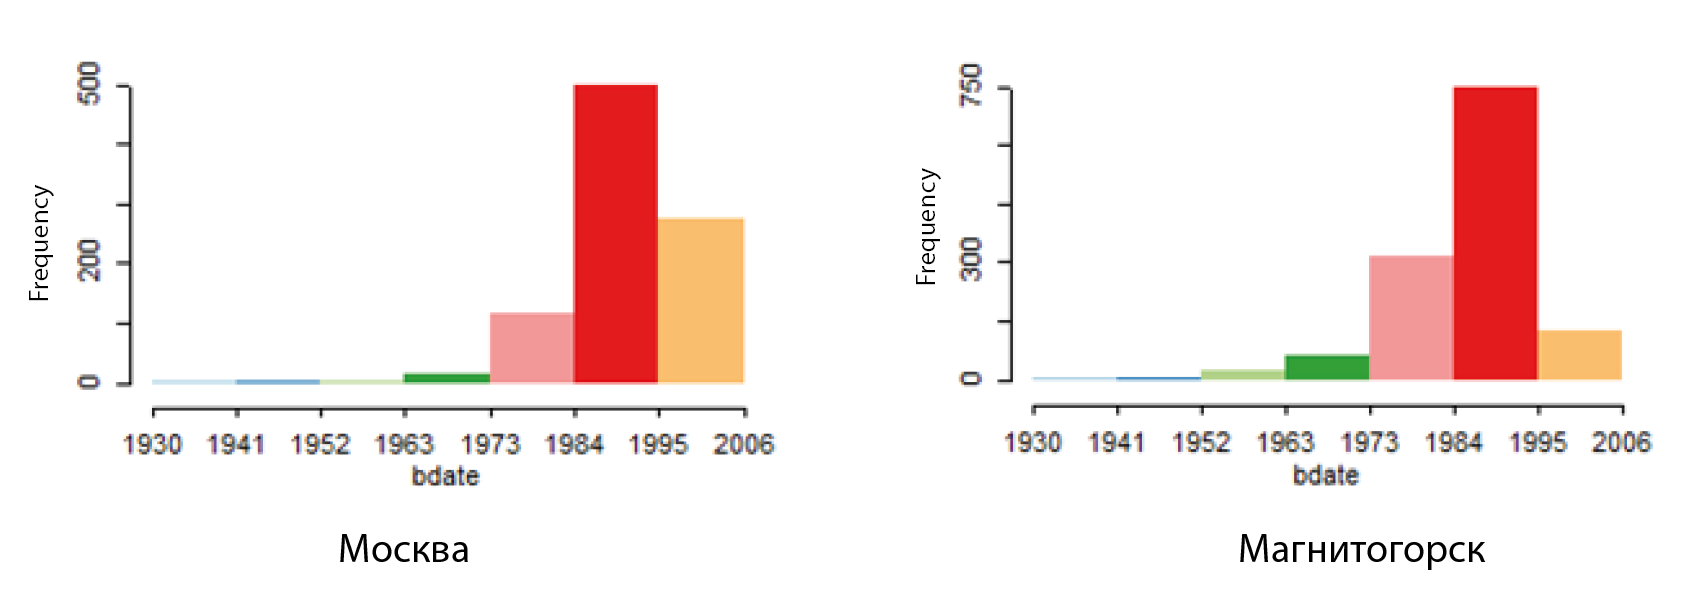
In general, these calculations can be confirmed by analyzing the age structure of participants in the context of each city. For example, with an equal range of birth years among group members (1930-2006 years of birth) in Moscow for 914 observations, the average value is 1991, the median is 1992, and in Magnitogorsk for 1271 observations, the average value is 1986, the median is 1987 (Fig. 4).
If you pay attention to the localization of blue dots, you can notice their concentration in the region of the southern Urals, in the immediate vicinity of the Abzakovo ski resort. This, in turn, indicates that proximity favors reaching older tourists. In the south and south-west of the country, red dots predominate, indicating that in these observation areas - group members have higher values of the birth year (that is, younger people against the entire set of observations), coexist with similarly relatively younger group members. Indirectly, this suggests that in these cities there may be groups with common values, including an interest in skiing. Objectively, when communicating, people pass the information about the resort "by word of mouth", contributing to the expansion of the circle of tourists in this age group. Such an understanding of the distribution features of potential customers in the ski resort determines the strategies for its promotion in various territories.
Fig. 1. Histogram of the age of the Abzakovo group participants included in the analysis
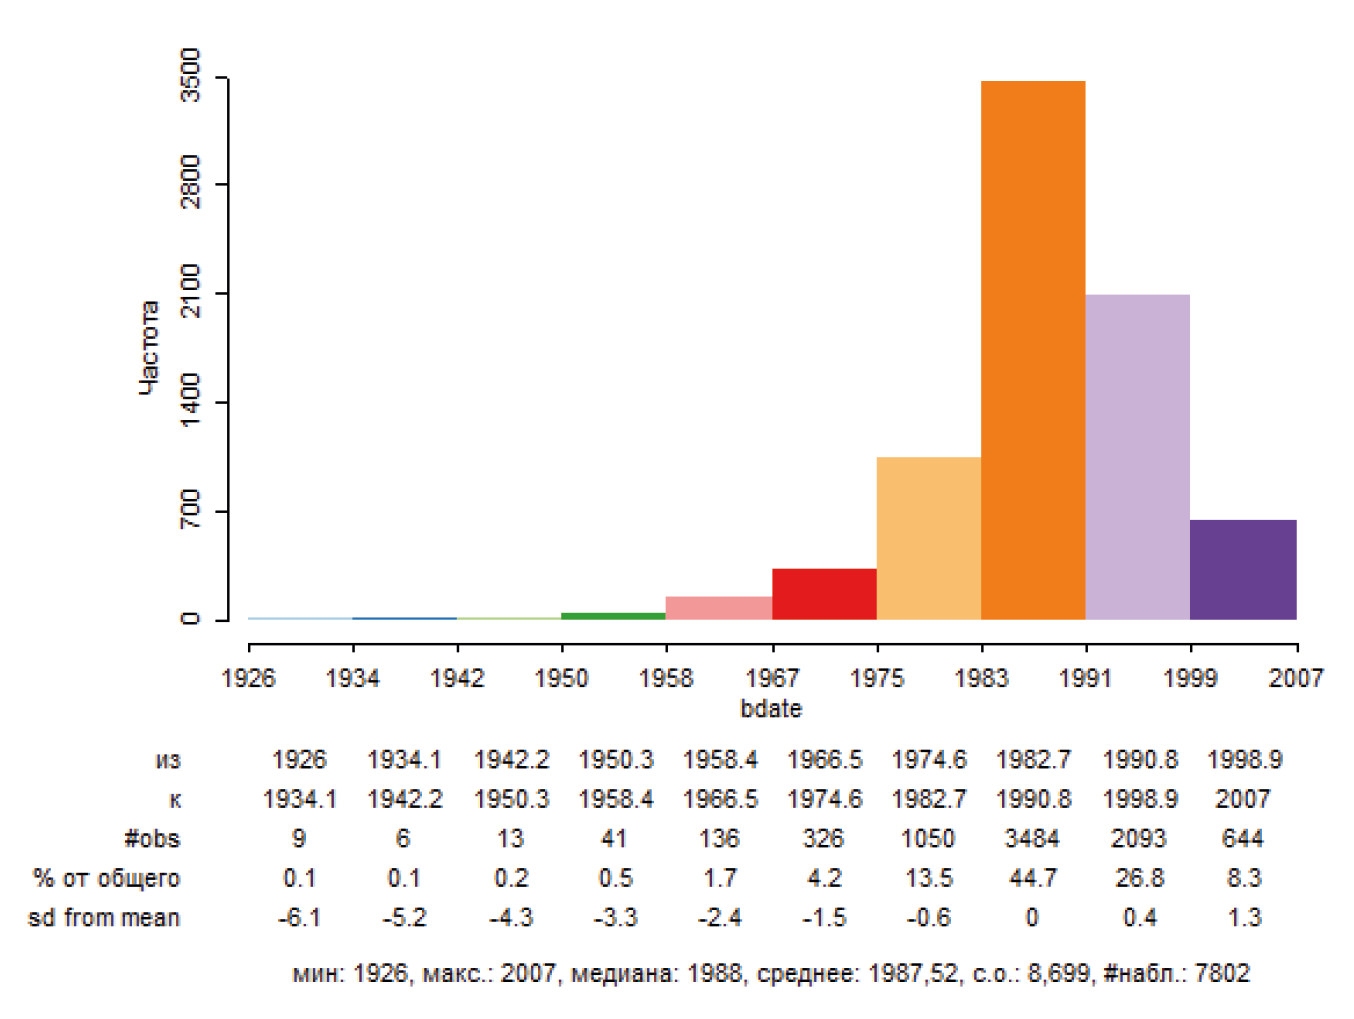
Fig. 2. Ratings of accommodation and food facilities from Google maps
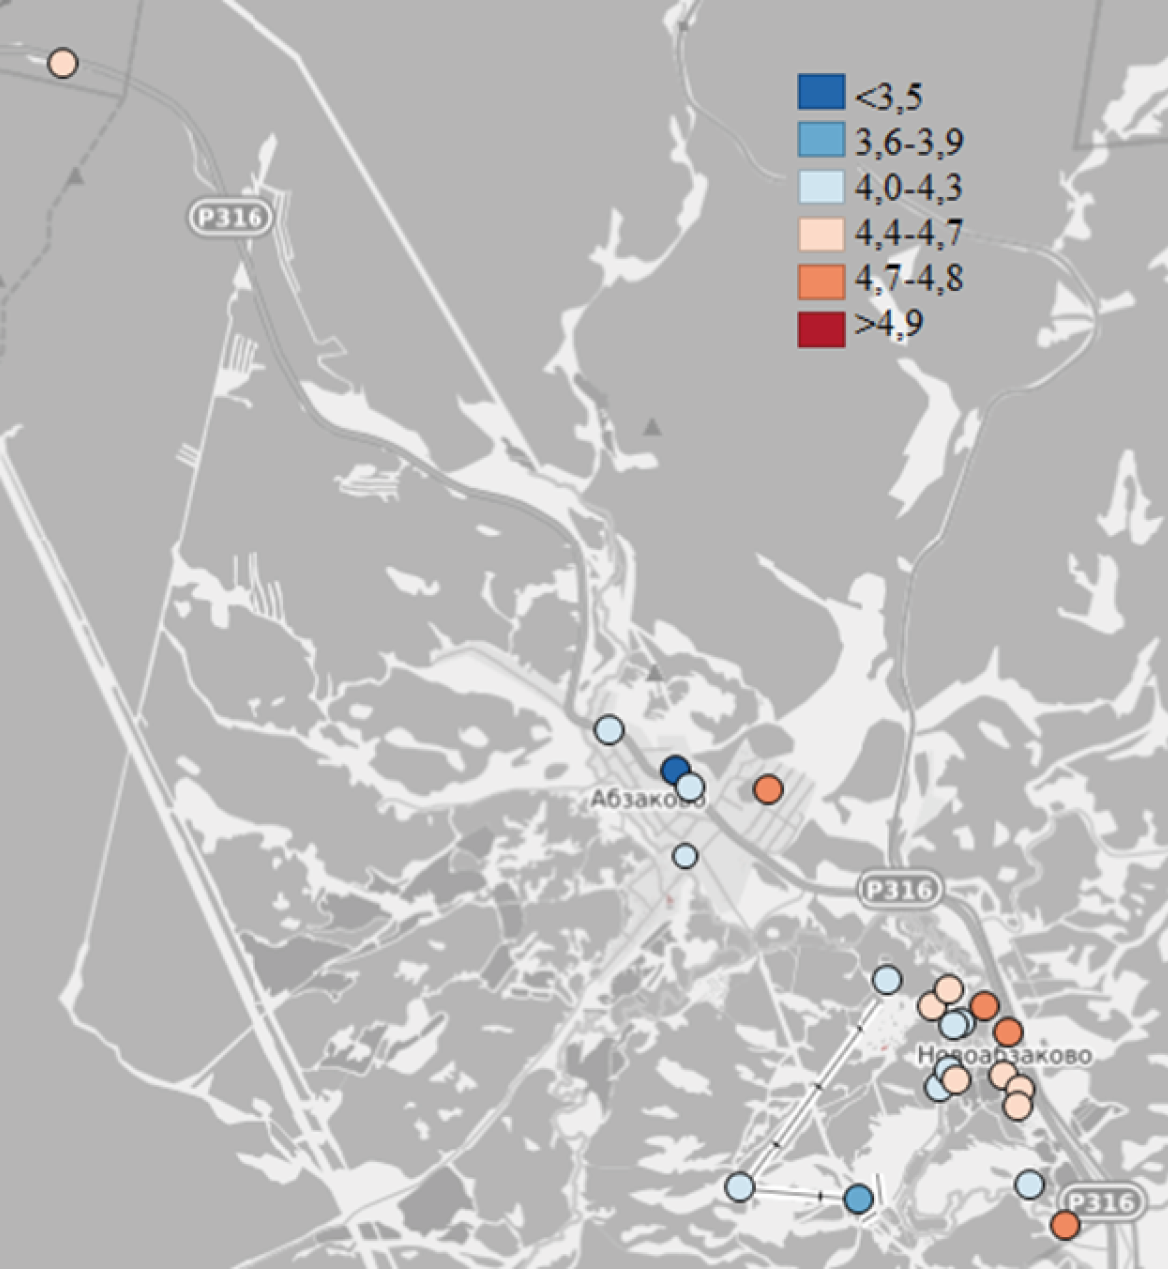
Fig. 3. Local Moran’s I for Abzakovo group members located in Russia
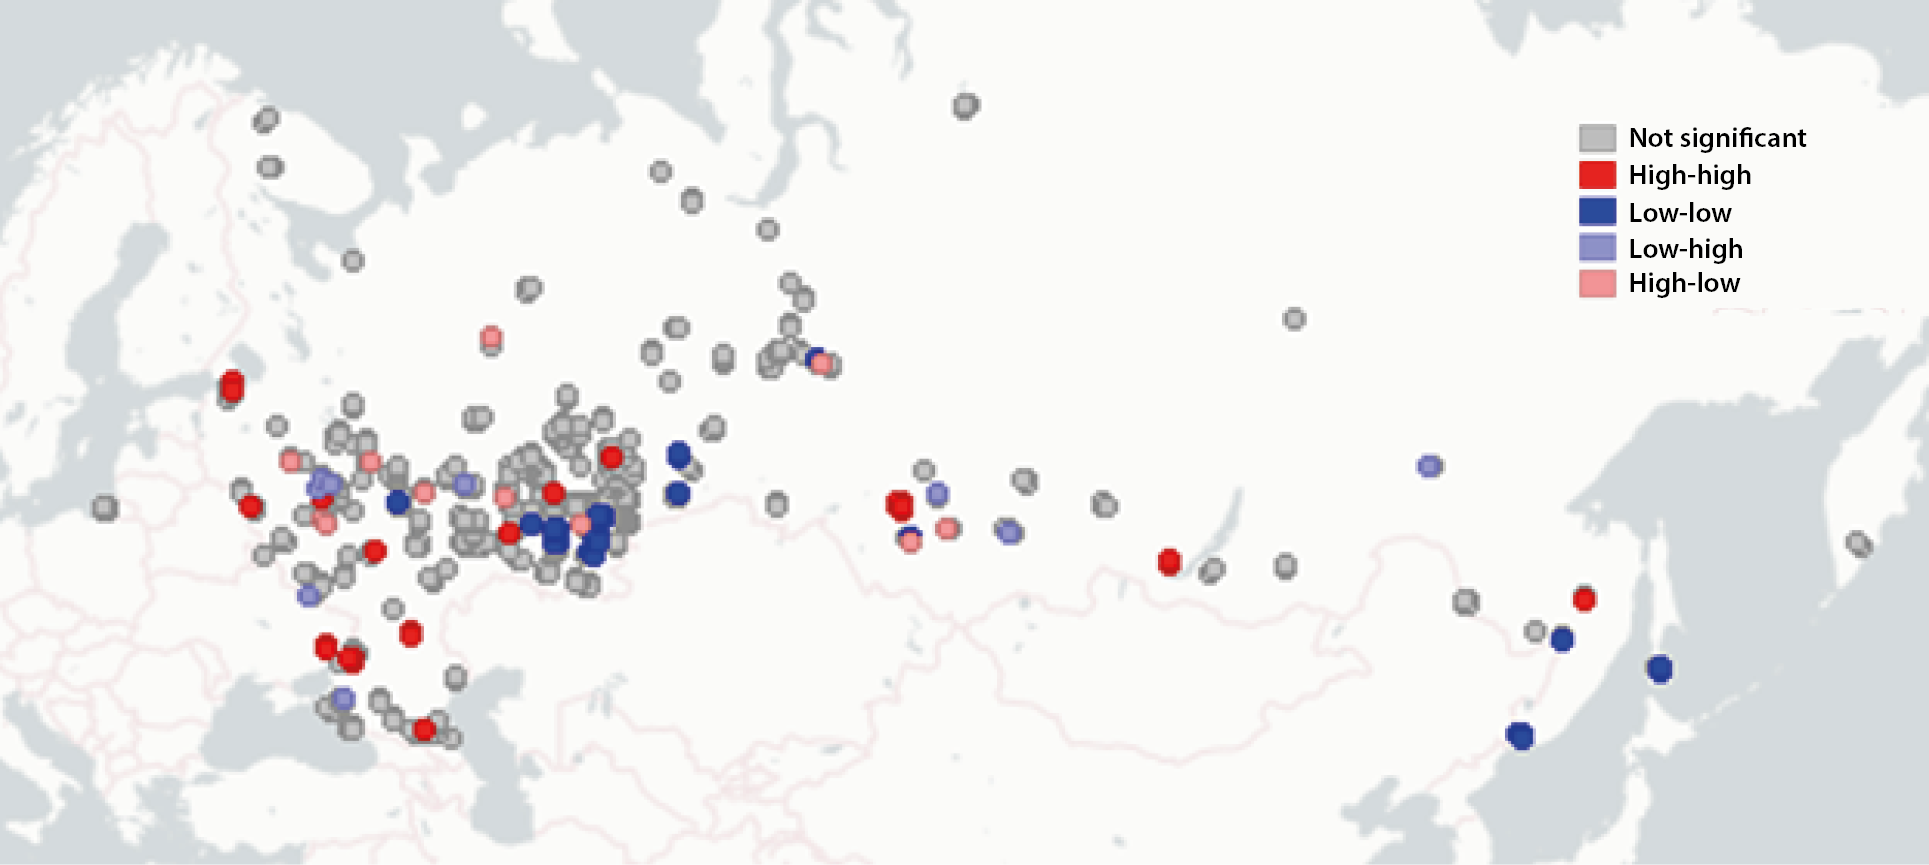
Fig. 4. Histograms of the Abzakovo group members located in Moscow and Magnitogorsk
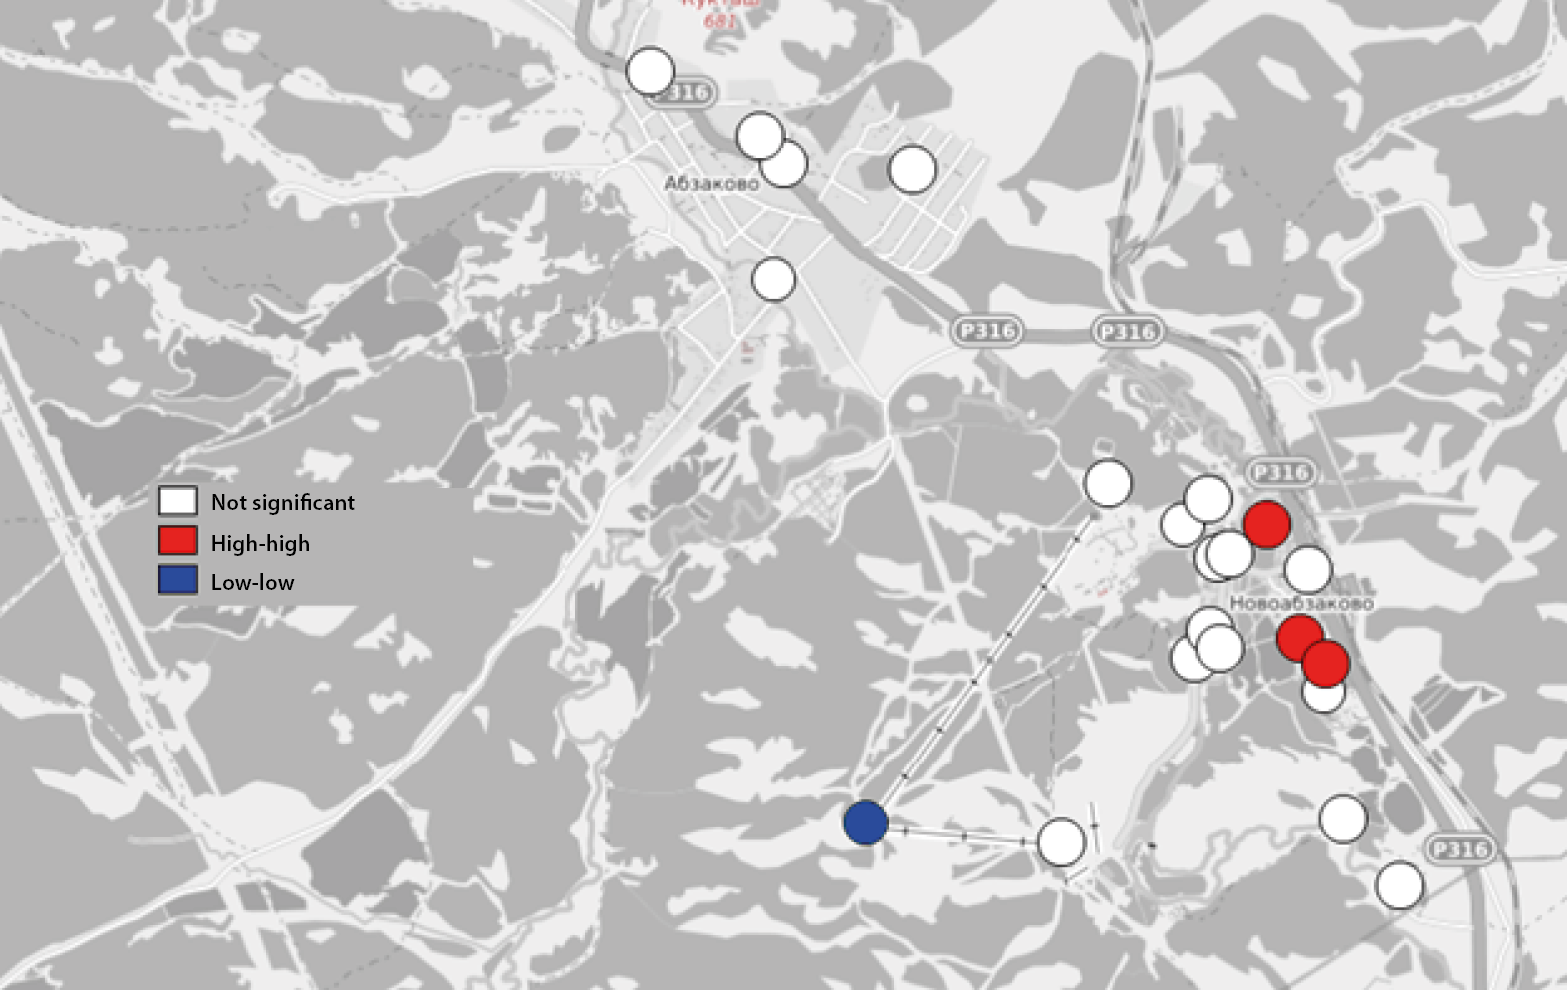
The geography of infrastructure facilities and the ratings they received on Google maps are shown in Fig. 2. It can be seen that the objects located directly on the skiing run and in Abzakovo are not very popular with tourists. However, spatial analysis allows you to evaluate the infrastructure from the perspective of the environment. Calculation of local Moran's indices made it possible to single out four statistically significant points. At the bottom of Fig. 5, a blue dot is clearly visible. It indicates that this object has low rating values and is surrounded by objects that also have relatively low rating values.
In Novoabzakovo, three red dots stand out, which are characterized by relatively high ratings. They are surrounded by objects that also have relatively higher ratings. Here, the emphasis is not on the rating of the object, but on the ratio of its rating and the rating of the environment, as well as the concentration of such objects in space.
Fig. 5. Local Moran’s I for infrastructure facilities of the Abzakovo ski area
At present, with the development of information technology, the range of data taken into account when making strategic decisions, can be significantly expanded. The emergence of open sources with unlimited information, which in addition is geographically structured, suggests a wide range of opportunities. In the framework of this study, a small example of such opportunities was presented, including the use of new technologies for data collecting, as well as their subsequent analysis by methods of spatial statistics.
The results of the geography analysis of the Abzakovo group members showed not only their predominant residence in the South Ural region, but also made it possible to identify a statistically significant spatial dependence of their age, which manifests itself in the neighborhood of older members of the group near the resort. The analysis results of tourist infrastructure objects ratings in the area of the Abzakovo ski resort showed that more rated objects are grouped in the eastern districts of the Novoabzakovo village, and spatially related low values are noted in the ski area. When analyzing infrastructure facilities, no statistically significant inverse relationships were identified. At the same time, during the analysis, they are of the greatest interest, focusing on objects with low values of indicators in comparison to the environment with high values, and vice versa.
Of course, further analysis of the reasons for this situation is required here. However, in the present work, such a problem was not stated. The key goal was to identify the opportunities that open up new tools that develop with the advent of big data. It should be realized, that in this case a small number of observation objects were analyzed. When moving to a larger number of observations, the speed of determining key points in space that require different approaches to study becomes extremely important, which can be obtained with new tools for data collecting and analyzing. In addition, an increase in the number of observations expands the possibilities of including more features in the models and contributes to an increase in the degrees of freedom in econometric models that determine the reliability of statistical estimations. It is necessary to note a number of shortcomings, in particular, inherent in parsing as a method of collecting data for analysis. First of all, this is the impossibility of verifying the accuracy of the information indicated by the participants in the personal profiles of social networks, as well as the subjectivity and artificial wrapping of ratings on interactive maps. The second disadvantage is the partial absence of information on a number of fields that are optional, as well as their hiding by privacy settings. It is also necessary to take into account that activity on the Internet is not characteristic of all people. Therefore, when analyzing the content of social networks and ratings, you need to understand that these are the opinions of people with a certain temperament, social type, etc.
1. A set of software tools for working with data through HTTP requests.
2. Data collection was carried out with the consent of the group.
1. Bulgakov D.S. (2018). Using the NLTK package and the Vader model to assess the tourist attractiveness of a country on the example of the Russian Federation. Web of Scholar, 2(20): 4-7. (In Russ.)
2. Butenko I.V. (2015). Trends in the development of the tourism industry in Russia. Statistics and Economics, 5: 90-93. (In Russ.)
3. Dneprovskaya N.V. (2020). The method to study the competencies of the subjects of the digital economy. Open Education, 24(1): 4-12. (In Russ.)
4. Dombrovskaya V.E. (2020). Aspects of tourist branding of the territory on the example of the Tver region. Herald of Tver State University. Ser. Geography and Geoecology, 3(31): 94-101. (In Russ.)
5. Pigareva E.Yu., Shevelev I.A. (2018). Instagram user data as a basis for marketing analysis in event tourism. In: Sharova I.S.,
6. Iolin M.M. (comp.). Tourism and recreation: Innovations and GIS technologies: Materials of the X International scientific and practical conference (Astrakhan, May 26-27, 2018). Astrakhan, Novaya liniya, 6-12. (In Russ.)
7. Plotnikov А.V. (2016). Analysis of geo-dependent requests in Yandex search engine to attract enrollees. Practical Marketing, 1(239): 12-16. (In Russ.)
8. Seliverstov Ya.A., Nikitin K.V., Shatalova N.V., Kiselev A.A. (2019). Road pavement assessment of the North-West Federal District using sentiment analysis of the Internet user reviews. St. Petersburg Polytechnical University Journal. Computing, Telecommunication and Control, 12(3): 7-24. (In Russ.)
9. Tarkhov S.А. (2019). Spatial approach to tourism geography. Geographical Bulletin, 4(51): 172-178. (In Russ.)
10. Trifonov N.Yu., Livinskaya V.A., Korzhukov V.V. (2020). Regression model for car valuation based on internet data parsing. System analysis and applied information science, 2: 4-9. (In Russ.)
11. Tsyganova M.S., Buresh S.V., Chernushenko D.A. (2020). Data analysis instrumentation development for public procurements under 44 and 223 federal laws (based on loginom analytical platform). Cherepovets State University Bulletin, 6(99): 59-72. (In Russ.)
12. Shvedov D.I. (2017). Parsing and matching of data for on-line analysis of dynamic situations. Mining Informational and Analytical Bulletin, 6: 200-204. (In Russ.)
13. Adhinugroho Y., Putra A.P., Luqman M., Ermawan G.Y., Takdir, Mariyah S., Pramana S. (2020). Development of online travel Web scraping for tourism statistics in Indonesia. Information Research, 25(4): 885. URL: https://doi.org/10.47989/irpaper885.
14. Alaei A.R., Becken S., Stantic B. (2017). Sentiment analysis in tourism: Capitalizing on Big data. Journal of Travel Research, 004728751774775.
15. Anselin L., Syabri I., Smirnov O. (2002). Visualizing multivariate spatial correlation with dynamically linked Windows. Computing Science and Statistics. URL: https://www.semanticscholar.org/paper/Visualizing-Multivariate-Spatial-Correlation-with-Mirnov/4e34bd70317377971ba8df7259288b972ad6a239.
16. Chang Y.-C., Ku C.-H., Chen C.-H. (2020). Using deep learning and visual analytics to explore hotel reviews and responses. Tourism Management, 80: 104-129.
17. Ćurlin T., Jaković B., Miloloža I. (2019). Twitter usage in Tourism: Literature review. Business Systems Research, 10(1): 102-119.
18. Lee Y., Pennington-Gray L., Kim J. (2019). Does location matter? Exploring the spatial patterns of food safety in a tourism destination. Tourism Management, 71: 18-33.
19. Li D., Zhou X., Wang M. (2018). Analyzing and visualizing the spatial interactions between tourists and locals: A Flickr study in ten US cities. Cities, 74: 249-258
20. Moran P. The interpretation of statistical maps (1948). Journal of the Royal Statistical Society, ser. B, 10: 243-251.
21. Piccoli G. (2001). Web-site marketing for the tourism industry: Another view. The Cornell Hotel and Restaurant Administration Quarterly, 42(6): 63-65.
22. Salas-Olmedo M.H., Moya-Gómez B., García-Palomares J.C., Gutiérrez J. (2018). Tourists’ digital footprint in cities: Comparing Big Data sources. Tourism Management, 66: 13-25.
23. Zhang S., Zhang G., Ju H. (2020). The spatial pattern and influencing factors of tourism development in the Yellow River Basin of China. PLoS ONE, 15(11): e0242029. URL: https://doi.org/10.1371/journal.pone.0242029.
24. Irina A. Lakman
25. Candidate of technical sciences, associate professor, head of the Laboratory for the Study of Socio-Economic Problems of the Regions of the Bashkir State University (Ufa, Russia). ORCID: https://orcid.org/0000-0001-9876-9202, ResearcherID: K-6878-2017, Scopus Author ID: 57192164952.
26. Research interests: methods of statistical (econometric) modeling, predictive analytics, socio-economic and biological systems.
Candidate of economic sciences, associate professor, senior researcher, deputy head of the Laboratories for the Study of Socio-Economic Problems of the Regions of the Bashkir State University (Ufa, Russia). ORCID: https://orcid.org/0000-0002-1004-0722, ResearcherID: N-3449-2015, Scopus Author ID: 57194428883. Research interests: methods of statistical (econometric) modeling, consumer behavior, spatial economics.
Candidate of economic sciences, associate professor, senior researcher, deputy head of the Laboratories for the Study of Socio-Economic Problems of the Regions of the Bashkir State University (Ufa, Russia). ORCID: https://orcid.org/0000-0002-1004-0722, ResearcherID: N-3449-2015, Scopus Author ID: 57194428883. Research interests: methods of statistical (econometric) modeling, consumer behavior, spatial economics.
Lakman I.A., Timiryanova V.M. STRATEGIC DECISIONS IN THE TOURISM INDUSTRY BASED ON INTERNET DATA COLLECTION TECHNOLOGIES AND THEIR SPATIAL ANALYSIS. Strategic decisions and risk management. 2021;12(2):170-177. https://doi.org/10.17747/2618-947X-2021-2-170-177
Ligovsky av 73, of.401, Saint Petersburg, 190040, Russia
Tel.: +7 (812) 346-50-15 (16)
Real Economy Publishing House.
E-mail: info@jsdrm.ru
Registration certificate PI No. FS-77 - 72389 from 02.28.2018, issued by the Federal Service for Supervision in the Sphere of Communications, Information Technologies and Mass Communications.
Processing of personal data


