


Contents
Scroll to:
https://doi.org/10.17747/2618-947X-2020-3-286-293
Scroll to:
Commercial activity has always been influenced by the competitive environment and its spread to the online space is the next stage of development and a defining trend for the nearest time horizon. The changes in the business landscape influenced by COVID19 pose new challenges for marketers and entrepreneurs. It is necessary to use the forced sharp increase in online interaction with consumers. The course towards the digital economy determines the use of scientific, mathematical methods to optimize the target indicators of economic activity. These global shifts in business interactions are generating innovative tools for measuring business results and transforming old practices to meet new market realities. This is the basic condition for the sustainability of doing business in any industry. This study is devoted to the development of a theoretical description of the process of multi-stage interaction with a consumer pool. To solve this problem, a mathematical model has been developed, the basis of which is digital information interaction, starting from the stage of determining the target audience and ending with the complete completion of a commercial transaction. This article presents the results of modeling sales funnel, as the basis for the software of a modern market analyst, using a cross-system approach. In contrast to the classical sales funnel, the presented algorithms allow using the multidimensional conversion funnel not only for assessing business results for the reporting period. Thanks to the flow of model arguments in real time, it becomes possible to optimize the business process by moving to the concept of leading economic indicators.
In practice, this means the ability to implement effective business planning on digital platforms. The arguments of the mathematical model are Internet statistics, the dynamics of consumer preferences, the history of the business process accumulated in the big data system. At the same time, the means of queuing theory, differential calculus, economic and mathematical modeling are involved, based on indicators such as KPI (Key Performance Indicators), CTR (click-through rate), CR (Conversion rate). This made it possible to formulate the concept of a digital twin of a commercial process and its transformation, convenient for practical applications, into a conversion funnel for embedding into algorithms implemented on a computer.
Sergeev S.M., Barykin S.E., Ostrovskaya N.V., Yadykin V.K. CALCULATION OF THE DIGITAL TWIN OF THE SALES FUNNEL. Strategic decisions and risk management. 2020;11(3):286-293. https://doi.org/10.17747/2618-947X-2020-3-286-293
The retail audit of the first half of 2020 showed that new processes are developing in the field of e-commerce. If earlier this channel was used for the purchase of large durable goods and online purchases on the global Internet sites of large aggregators, now the processes of shifting consumer interest towards everyday goods are clearly observed. A sharp increase in consumer activity in the FMCG segment was noted in the Nielsen review and identified as a longterm trend. Among the fundamental changes in the structure of consumer demand are also the growth of purchases from mobile devices, cross-border purchases and work on the D2C (direct to customer) model. In 2019, the entire e-commerce segment of the Russian Federation was estimated at 4172 billion rubles.; for the first half of 2020, the volume of online purchases significantly exceeded the level of the same period last year. This is primarily due to the impact of the new reality caused by the COVID-19 pandemic, which simultaneously gave impulse to the expansion of online commerce, and this process continues even after the easing of quarantine measures, as the population has appreciated the advantage of online shopping. The change in consumer behavior is also reflected in Nielsen data on the growth by 4.2% in the level of Internet coverage of the population. It is noted that the mobile Internet segment has also grown, which is used by 86.2 million people, which is 70.5% of Russian population.
The use of a wide range of economic indicators, displayed in digital form, allows to implement the entire chain of business interaction in the online space. For commercial success and winning in the competition, it is necessary to inform potential consumers. Taking into account the multi-stage nature of transactions, there is a requirement for maximum efficiency of each stage. Now the sales funnel method for monitoring all stages of business processes is well known. The transition of a significant share of business processes to online, conversion measurement transforms this method into a new quality of conversion funnel. The effectiveness of mobile applications requires scientifically based algorithms that use feedback from real-time data on consumer activity. A business built on this approach and information support for management decisions based on leading indicators will provide an advantage in the competition.
The sales funnel is a marketing model that reflects the theoretical path (which, in our opinion, can be called an abstract path) of a client from getting acquainted with the product to concluding a transaction [Kolosova, 2019]. The sales funnel in its ideal embodiment can be represented as a tactical scheme for formalizing the step-by-step path of some ideal consumer. In reality, buyers move along such an abstract path non-linearly, returning to the previous step, rethinking their movement, and possibly losing their purchasing power or need for a particular product. In any case, the sales funnel is a mandatory element of the marketing concept, as it allows you to find problematic sales stages and eliminate them. The goal of a sales funnel is to turn a potential customer into an actual buyer. The sales funnel consists of external and internal parts: from the beginning of the abstract path, when the audience is not yet familiar with the product (external funnel), to the final point (internal funnel) of interaction between the supplier and the buyer.
The indicators of the sales funnel can be divided into quantitative and qualitative. Quantitative indicators are used to calculate the conversion rate and allow you to find out what percentage of potential customers moved from the previous stage to the next. The conversion rate of a digital sales funnel is calculated as the ratio of the number of customers moving to a new step in the funnel to the number of customers remaining in the previous step. Qualitative indicators allow you to find out the reasons for the loss of customers. The analysis of these indicators also allows you to identify existing problem points and organize work aimed at eliminating them. To analyze the bottlenecks of the sales funnel, a consistent assessment of the impact on the profit of each of the metrics can be carried out: the number of informed customers at the top of the funnel, the conversion of informed customers into order-takers and end users [Vasileva, Loseva, 2019]. Conversion losses depend on the convenience of the site, the terms of purchase, the value offer or discount program, the ill-considered conduct of the potential customer from the choice of the product to the payment method, delivery, and then to the after-sales service. The site's sales funnel allows you to manage the trading process. The process of establishing a flow of interested buyers is a lead generation (leads – site visitors who are interested in purchasing a product, left their application or at least contact information). A predeveloped scenario of interaction with the client, starting from the moment of greeting and ending with the execution of the transaction, is a sales script (there are scripts for an incoming call and scripts for an outgoing call of a call center)1.
According to the hierarchical model of communication, the sales funnel, in order to sell something, it is necessary to go through the stages of communication with the client from attracting attention to the proposed product to making sure that the right choice will lead to a purchase, while the number of potential customers at each stage is reduced. In the hundred years that have passed since the introduction of this term, the principles of selling have remained unchanged.
"A real sales consultant should be a good marketer, looking at everything through the eyes of the buyer and able to prepare the buyer for the purchase" -these are the words of A.Townsend, who proposed the marketing model "sales funnel" in 1924 in the development of the AIDA model (Attention, Interest, Desire, Action), developed by E. Lewis in 1896.
A.Peterson in 1959 published a visual image of the sales funnel in the book "Sales in pharmaceuticals, "detailing" and sales training". Describing the importance of moving from the general to the particular, the author noted: "This can be compared to the movement of matter through a funnel or a V-shaped percolator." This movement he called the funnel of progression [Peterson, 1959].
The variant of the classical model is modified by many modern authors, such as H. J. Friedman [Friedman, 2018], K. Smith [Smith, 2018], I. B. Mann [Mann, 2019], A. P. Repyev [Repyev, 2015]. A step-by-step plan for attracting potential customers via the Internet was developed by Smith in [Smith, 2018]. Friedman reveals the methods of turning potential buyers into those who actually buy.
The specific, detailed version of the sales funnel can be different for different types of businesses, depending on what problems need to be solved. A typical sales funnel in internet marketing is called a conversion funnel. Internet technologies allow you to control the quantitative indicators of conversion rates at various stages.
Psychology considers the sale of goods and services as a reason and a reason for communication that takes place on the basis of the laws of communication.
In 1896, one of the first hierarchical models of communication was proposed by Lewis, who formulated the slogan "Attract attention, maintain interest, create desire". Later, he added a fourth slogan - "get action." In 1916, the psychologist G. F. Adams wrote that the psychological states of "sensation, attention, association, fusion, memory, appearance, and action" should be taken into account when advertising and selling.
A person can be controlled with a sufficient set of stimuli. Under the influence of internal and external factors, a person experiences conscious states: attention, interest, desire, action, satisfaction. By adjusting external factors, it is possible to facilitate the transition of a person from one state to another and further to the final state of satisfaction.
Later, the communication model was also used to predict sales. At the present time, the model is also used to guide advertising campaigns aimed at various ways to search for products by the customer on the internet.
The forecasting necessary for effective commercial activity should consider many stages of interaction with the consumer pool. The sales funnel representation of the process used in analytics is widely used for evaluating sales results. However, such a tool is designed for offline sales and is nothing more than a convenient abstraction. In addition, the results of using sales funnel are limited by the fact that lagging indicators appear in this model. The processes taking place in online trading allow us to radically transform the sales funnel and turn it into a powerful business forecasting tool with the ability to objectively evaluate all stages of commercial interaction. For such a transition, it is necessary to formulate the fundamental differences in its application at the present stage. The initial and final stages - prospective customers, unformed preferences, and product delivery, accordingly reflect basically the same set of consumers, but the sources of information - consumer awareness and loyaltyare completely different. If the sales funnel uses methods of interaction such as cold call, then in the online mode it will be landing pages, or landing page, blog posts, and online tracking services, courier delivery, and online banking. You can also interpret transitions from offline modes for the following stages: initial contact, determining demand, evaluating a potential purchase, intentions, purchase. These will be, respectively, potential customers who have shown interest, clarification of a set of requirements, content sites, targeted marketing, advertising on social platforms, and estimation of potential opportunities. The stages of the offer, the calculation will be the following set: SEO (search engine optimization), SEM (Search Engine Marketing), viral advertising, IFO (Irresistible Free Offer). Consultation, discussion of disagreements, objections, the final offer turns into the registration of the client and subscription to the services. Separately, we note the completion of the transaction, which now has the form "product registration system", "internet banking".
The task of this study is to formalize the description of the stages of online interaction, to compile a mathematical model and to find methods for optimizing the commercial process in this paradigm.
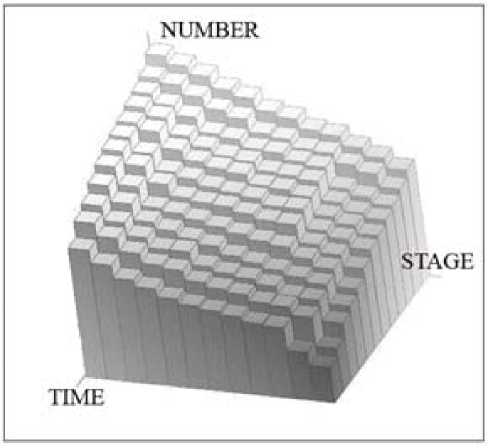
Since the process of interaction with consumers of goods and services is divided into a number of stages, we will introduce the corresponding X-axis. The client moves along this axis, going through the stages of the commercial process from the initiation of his interest to the final transfer of money [Sergeev, 2015]. For a quantitative description of the situation in dynamics at each stage along the X-axis, we will set aside a value numerically equal to such commercial indicators as customer requests, offers made, contracts concluded, etc. A decreasing number of potential consumers move on to each next stage. Thus, we observe the functional dependence of Q(x,t) not only on the X-axis of stages, but also from time t. This formalism reflects the level of demand of potential consumers, located at the moment t at the stage x∈X on the offered product or service. If we determine the virtual shift of the consumer with t=t* along the X axis starting from some stage x1 to the subsequent x2, then we can write the following expression to estimate the losses W of potential customers:
 (1)
(1)
This indicator is called the bounce rate and is used to determine the effectiveness of commercial services at this stage. The limit values at the transition x1 → x2 give an instantaneous value of W, numerically equal to the partial derivative: 
Thus, the bounce rate level changes along the X -axis, and the essence of the variable W зconsists in the degree of narrowing of the sales funnel. Physically, this means the ratio of the number of  potential customers, for the period of time Δt passed to the stage x1, to the reduced number of them at the exit from x2. This is expressed by the ratio
 (2)
(2)
This problem arises in a number of applications of queuing theory. Indeed, in this case, the mathematical formalisms reflect the process of passing the initial flow through a sequence of service points, in each of which there are losses of its intensity. Such an operation can be represented in the form of sequential operations: Tq1, Tq2, ..., TqN, where qi is the probability of a potential customer moving from the i stage of the commercial process to the next one. Accordingly, the losses occur with frequency pi =1 – qi. To be able to apply Renyi's theorem, we change the time scale [Sergeev, 2016]. The coefficient on the time scale will be the value of (qi)–1. Then, according to Renyi's theorem, the sequential passage through the stages of commercial interaction is equivalent to the transformation Tq1q2...qN. In this case, the sequence of such decreasing flows will converge with a high degree of confidence to the Poisson point process. It is necessary to fulfill the conditions of homogeneity:  which in practice means similar performance indicators of the stages of commercial interaction. The obtained result allows us to proceed to mathematical modeling of the level of organization of interaction with the consumer at all stages of the sales process of goods and services.
The resulting mathematical description must be linked to the business quality indicators. For this purpose, we introduce the function q(x) to account for the Key Performance Indicator index, which determines the effectiveness of the organization of the commercial process at stage x = x1, x2, ..., xN, where N is the number of interaction stages. This integral indicator reflects both the degree of interest of potential customers, as well as the professionalism of developers of business schemes, mobile applications and the level of use of technological capabilities of online trading. The quality of work at stage x is the higher, the greater the value of g(x) [Kurochkina et al., 2018a]. When transition to the concept of conversion at stage x, its level is determined from the formula
g(x)–1 Δx(Q(x,t2) – Q(x,t1)) = q(x). (3)
For formalized accounting of the adverse impact of the competitive environment on the bounce rate W level, it is also necessary to introduce the D(x,t) function. This integral indicator takes into account the activities of competitors that divert part of the client pool, changes in legislation, and the influence of other market factors. The general equation of dynamics in this case has the form:
 (4)
(4)
this makes it possible, using the Lagrange theorem, to write a dynamic model of the process in the form
 (5)
(5)
Next, we will link the KPI index [Borisoglebskaya, Sergeev, 2018]. For this, the performance of the means of interaction with consumers is denoted as μn, where n is the stage number on the X-axis. The density of requests at the input to Xn is denoted as λn, the number of communication channels available to clients is equal to m (for example, the degree of performance of software-implemented mobile applications). The conversion rate is calculated using the formula
 (6)
(6)
Meanwhile, the impact of the competitive environment D(x,t) is taken into account by the losses v(t) of potential consumers, calculated by the formula:
 (7)
(7)
To calculate the dynamics of the business process, we calculate the input flow of potential consumers using the Verhulst equation [Sergeev, 2018]. At the same time Q0(t) is the volume of potential consumers at the beginning of the advancement, Ω supporting the capacity of the market, θ dynamics of consumer preferences [Iliashenko et al., 2018]. Use the ratio
 (8)
(8)
In the calculation process using a computer, we used an analytical solution of the equation in quadratures of the following form [Sergeev et al., 2016]:
 (9)
(9)
It should be noted that this ratio, or the logistics S-function, must have a starting value other than zero, which in practice corresponds to the volume of pre-orders for a product or service [Kurochkina et al., 2018b]. Then, taking the first derivative, we immediately get the dynamics of changes in the intensity of the flow of client requests, or the flow at the entrance to the conversion funnel, which is calculated by the formula
 (10)
(10)
The discreteness of the process is taken into account not only by the counting set of stages, but also by time. Since the discrete Verhulst equation is transformed into a Feigenbaum mapping, it is very convenient to use it for practical calculations with computer implementation [Sergeev et al., 2019].
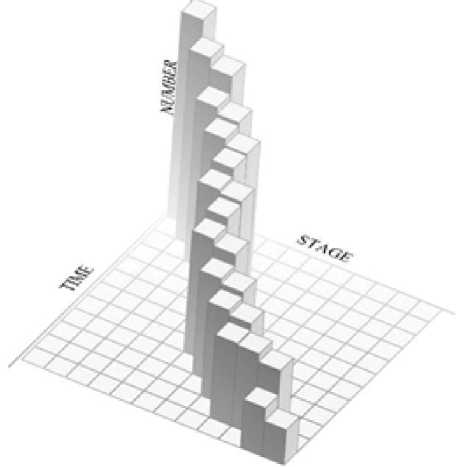
The process of online interaction (Fig. 1) is calculated using the presented model. Figure 2 shows the result of calculating the optimal business interaction. For this purpose, the exponential regression decrement index was used in the mathematical model calculation.
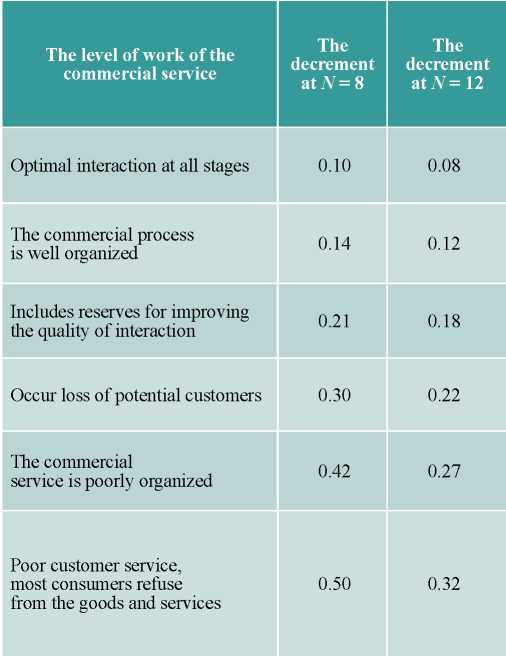
The results of the calculations allow us to tabulate data on the quality of the organization of the commercial process that is convenient for practical use (Table 1).
Table 1. The degree of quality of the commercial service
The process of digital transformation of the service sector is a complex process [Kalinina et al., 2019]. Various aspects of digitalization, including social aspects, should be taken into account [Burlankov et al., 2020]. Sales funnel appeared as a method of evaluating the company's work with consumers. At the same time, the use of such a tool is effective for those types of businesses that are characterized by a long sales process, a high level of interaction with potential customers of goods and services is important, and new consumers are actively attracted. In this type of offline trading, the use of sales funnel is acceptable in the B2B and B2C segments. The qualitative leap in the level of online trading in recent months is accompanied by the transition of the interaction process to the internet, as well as the expansion of the range of D2C interaction. The quality of website development, trade portals, platforms, and integration with other services determines the degree of conversion of potential consumers when moving from one stage of interaction to another. Thus, observed transformation of the process in the conversion funnel. Despite the similarity of the purpose of the processes within these two tools for promoting goods and services, they are fundamentally different. First, it is the transition to digital virtual interaction and real-time work. Secondly, the widespread use of aggregator sites, which provide greater opportunities to reach the client pool. Finally thirdly, and most importantly, a commercial enterprise has the opportunity to correct its strategy of market interaction, to optimize all stages of the business process by using algorithms based on leading economic indicators. The interpretation of the results obtained will be a set of tools that form the basis of software solutions in the form of expert systems for making management decisions in a commercial enterprise. Detailing the successive phases of the conversion funnel allows to identify the problems of the business organization ahead of time. It is also possible to predict future demand and necessary investments in real time. Financial and economic planning is carried out on the basis of a scientifically based, balanced analysis with the use of optimization methods.
1. What is a sales funnel – 7 stages of building an effective funnel + visual examples: URL: http://hiterbober.ru/business-terms/chto-takoe-voronka-prodazh-etapy-analiz-primery.html#4.
1. Vasilieva E.V., Loseva V.V. (2019). Voronka onlayn-prodazh kak analiticheskiy instrument upravleniya effektivnost’yu biznesa [Online sales funnel as an analytical tool for managing business performance]. Upravlenie [Management], 3, 63-74. DOI: 10.26425/2309-3633-2019-3-63-74.
2. Kolosova V.V. (2019). Mekhanizm postroeniya effektivnoy marketingovoy strategii na osnove primeneniya tsifrovoy voronki prodazh [The mechanism for constructing an effective marketing strategy based on the use of a digital sales funnel]. Vestnik Moskovskogo gosudarstvennogo oblastnogo universiteta. Ekonomika [Bulletin of the Moscow State Regional University. Economy], 1, 43-51. DOI: 10.18384/2310-6646-2019-1-43-51.
3. Kurochkina A.A., Lukina O.V., Sergeev S.M. (2018a). Planirovanie resursnoy zagruzki samykh poseshchaemykh megapolisov mira [Planning the resource load of the most visited megacities in the world]. Nauka i biznes: puti razvitiya [Science and Business: Ways of Development], 3(81), 123-127.
4. Kurochkina A.A., Lukina O.V., Sergeev S.M. (2018b). Primenenie tsifrovykh tekhnologiy v reshenii ekologicheskikh problem megapolisa [The use of digital technologies in solving environmental problems of a megapolis]. Perspektivy nauki [Prospects for Science], 9(108), 194-197.
5. Mann I.B. (2019). Marketing na 100%. Remiks [Marketing 100%. Remix]. Moscow, MIF.
6. Repyev A.P. (2015). Kak prodavat’ produkty trudnogo vybora [How to sell products of difficult choices]. Moscow, Litagent Byblos.
7. Smith K. (2018). Konversiya: Kak prevratit’ lidy v prodazhi [Conversion: How to turn leads into sales]. Moscow, Alpina Publisher.
8. Friedman H.J. (2018). Net, spasibo, ya prosto smotryu. Kak posetitelya prevratit’ v pokupatelya [No thanks, I’m just looking: Sales techniques for turning shoppers into buyers]. Мoscow, Olimp-Biznes.
9. Borisoglebskaya L.N., Sergeev S.M. (2018). Model of assessment of the degree of interest in business interaction with the university. Journal of Applied Economic Sciences, 12(8), 2423-2448.
10. Burlankov P.S., Dolbik-Vorobey T.A., Kremer N.Sh., Ostrovskaya N.V., Zhukova G.S. (2020). Digital technologies for implementing corporate social responsibility. Bulletin of National Academy of Sciences of the Republic of Kazakhstan, ISSN 1991-3494, 2, 384(2020), 99-105.
11. Iliashenko O., Krasnov S., Sergeev S. (2018). Calculation of high-rise construction limitations for non-resident housing fund in megacities. E3S Web of Conferences, vol. 33. March 6. Paper number 030062017 International Scientific Conference on High-Rise Construction, HRC 2017, 03006.
12. Kalinina O., Kapustina I., Buniak V., Golubnichaya G. (2019). Economic features of investment nature of energy-saving projects in Russia. E3S Web of Conferences, 02089.
13. Peterson A.F. (1959). Pharmaceutical selling, “detailing,” and sales training. Scarsdale, NY, Heathcote-Woodbridge.
14. Sergeev S.M. (2015). Cross-systems method of approach to energy economy higher educational institutions. In: Sibirskaya E. (ed.). Economics. Society: Selected papers of the international scientific school “Paradigma” (Summer-2015, Varna, Bulgaria), Yelm, WA, USA.
15. Sergeev S.M. (2016). Cross-system way of looking to business with limited resources. In: Kravets O. (ed.). Economics. Society: Selected papers of the international scientific school “Paradigma” (Winter-2016, Varna, Bulgaria). Yelm, WA, USA.
16. Sergeev S.M. (2018). Expansion of DEA methodology on the multimodal conception for the 3PL. In: Kravets O. (ed.). Modern informatization problems in simulation and social technologies. Proceedings of the XXIIIth International Open Science Conference. Yelm, USA, 169-176.
17. Sergeev S.M., Sidnenko T.I., Sidnenko D.B. (2016). Distribution centers for agriculture, their modeling. In: Economics. Society: International Scientific School “Paradigma” (Summer-2016 Selected Papers). Yelm, WA, USA, 92-97.
18. Sergeev S., Kirillova T., Krasyuk I. (2019). Modelling of sustainable development of megacities under limited resources. TPACEE-2018. E3S Web of Conferences 91, 05007.
Sergeev S.M., Barykin S.E., Ostrovskaya N.V., Yadykin V.K. CALCULATION OF THE DIGITAL TWIN OF THE SALES FUNNEL. Strategic decisions and risk management. 2020;11(3):286-293. https://doi.org/10.17747/2618-947X-2020-3-286-293
Ligovsky av 73, of.401, Saint Petersburg, 190040, Russia
Tel.: +7 (812) 346-50-15 (16)
Real Economy Publishing House.
E-mail: info@jsdrm.ru
Registration certificate PI No. FS-77 - 72389 from 02.28.2018, issued by the Federal Service for Supervision in the Sphere of Communications, Information Technologies and Mass Communications.
Processing of personal data


