


Contents
Scroll to:
https://doi.org/10.17747/2618-947X-2019-4-306-319
Scroll to:
The digital transition in the electric power industry is a promising goal for the development of the industry. In recent years, a wide range of technologies has been introduced into various types of activities of energy companies, including significant attention being paid to technologies that implement demand-side management, transferring consumers from the passive category to active consumers, and also opening up new opportunities in energy management. Non-intrusive load monitoring technology is of significant interest for both electricity suppliers and consumers in the USA and EEC countries, however, a Russian-language study is being carried out for the first time.
The purpose of the study is to consider the concept of non-intrusive load monitoring, to formulate and systematize the effects for electric power industry entities and consumers of electricity from the introduction of technology.
A review of literary sources is carried out, the most cited articles on this topic are analyzed. To calculate the propagation rate of non-intrusive load monitoring, the Bass innovation diffusion model was used. The model allows to perform an assessment based on data on similar products and has established itself as sufficiently effective for predicting the distribution of durable goods, the actual information for which has not yet been collected.
For the first time, a classification of effects arising from the introduction of technology is proposed. The paper obtained a range of effects for households, energy companies, business and government. The calculation of the technology distribution rate showed that without the use of technological corridors and the systematic introduction by energy companies, the peak of adoption can be reached by 8 years from the start of implementation.
Non-intrusive load monitoring allows you to get a wide range of data in order to further optimize energy consumption, increase the efficiency of enterprises, monitor the operation of equipment. There are great opportunities in the commercialization of collected data.
Kuzmin P.S. NON-INTRUSIVE LOAD MONITORING: IMPLEMENTATION EFFECTS AND DISTRIBUTION PROSPECTS. Strategic decisions and risk management. 2019;10(4):306-319. https://doi.org/10.17747/2618-947X-2019-4-306-319
Russia is the world's fifth electricity market in terms of production and consumption, yielding the position to China, the United States, India, and Japan [Global Energy..., 2019]. In 2018, electric-power production in the Russian Federation amounted to 1070 billion kWh, as of January 1, 2019, the total station capacity of power plants of the Unified Power System in Russia reached 243,243.2 MW [SO UPS JSC, 2019].
Today, the electric power industry in Russia and around the world is undergoing significant changes due to the introduction of innovations of the fourth industrial revolution. Klaus Schwab, founder and President of the World Economic Forum, noted that the fourth industrial revolution is defined by interaction in the digital, physical, and biological fields [Schwab, 2016]. It should be noted that innovations can not only increase the efficiency and effectiveness of companies but also radically transform the market environment, leading to major changes in technical and economic paradigms and organizational models [Freeman et al., 1982; Technical Change…, 1987]. Thus, automation, the development of cyberphysical systems, the industrial Internet of things,and digital technologies radically transform the traditional technological and organizational structure in the electric power industry.
The need to transform Russia's energy sector is caused by a number of factors: on the one hand, these are internal tasks and challenges faced by the industry, on the other – global trends. Internal challenges are attributable to a high level of depreciation of fixed assets, an increase in the need for investment in the construction of new capacities due to increased energy consumption, as well as forcompensation for retirees [Development Strategy..., 2013; Energy Strategy..., [b.g.]], a shortage of personnel with the necessary qualifications and a decrease in labor productivity in the energy industry [Linder, Lisovsky, 2017]. At the same time, cross-subsidizing of the population leads to an increase in the cost of electricity for commercial and industrial enterprises [Linder, Trachuk, 2017; Khovalova, 2017]. Among the world trends, we can highlight the cheapening of energy produced using renewable primary sources, the largescale development of distributed generation and, as a result, the course towards energy decentralization, the introduction of technologies of the fourth industrial revolution, as well as the transition of electricity end-users from passive to active (prosumers) as a result of the spread of intelligent control systems [Khokhlov et al., 2018; Digital transition..., 2017].
As one of the key technologies of digital transition in the electric power industry, researchers identify intelligent accounting based on electric energy meters equipped with communicators and equipment for collecting, processing, storing, sending and receiving data [Kempener et al., 2013].
Smart metering has several advantages in comparison with traditional systems of power consumption accounting:
Among the information and measurement systems of electricity, special attention should be paid to meters designed with the use of non-intrusive load monitoring (NILM) technologies.
NILM is a method for analyzing aggregative electrical load data obtained by measuring current and voltage at a single point, then dividing the total load into individual device loads.
The concept of NILM was first proposed by George William Hart of the Massachusetts Institute of Technology in the early 1980s, and the operational procedures were patented in 1989 [Patent..., 1989]. The author described his technology as follows: "NILM is designed for monitoring an electrical circuit containing several independent devices. Specific analysis of current and voltage signals is used to evaluate the number and type of individual loads, their individual energy consumption, and other relevant statistics. Sensor installation and measurement do not require access to individual devices, which provides a very convenient and efficient way to collect load data compared to the method of placing sensors on each of the devices. The data obtained on final electricity consumption is extremely important for consumers, power supply companies, government authorities and appliance manufacturers" [Hart, 1992].
However, at the time of its appearance, the technology did not receive due attention in view of the complexity of implementation: the computing power of computers for processing statistical data was not sufficient. Over time, many scientists became interested in the idea, and research was conducted on both technical aspects and features of application and implementation. Figure 1 shows the number of publications for the "Non-Intrusive Load Monitoring" query included in the ScienceDirect database, broken down by year.
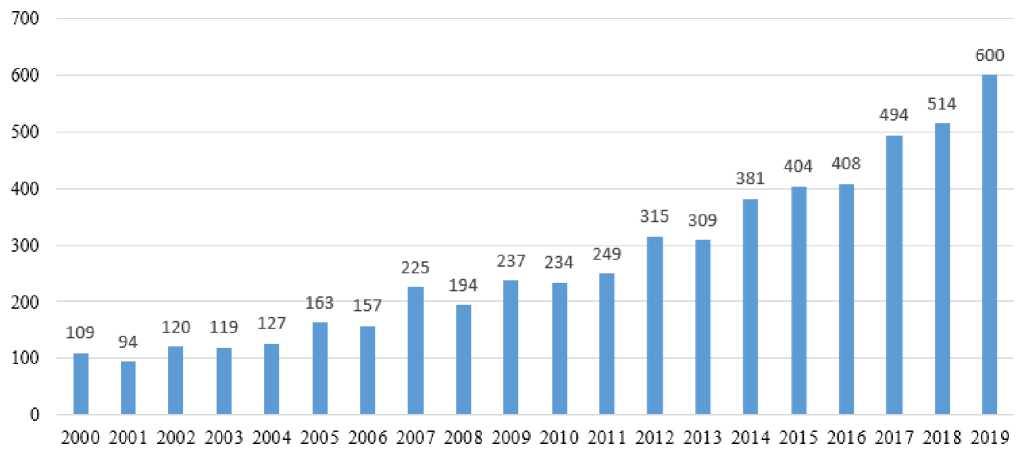
The nature of the trend and the compound annual average growth rate of 9.4% indicate an increase in technology relevance.
The purpose of this work is to identify, systematize and determine possible economic, social, technical and other effects of implementing non-intrusive load monitoring. Such effects can occur because of changes in the behavior models of industrial and private consumers, the transformation of business models of energy companies, as well as the creation of completely new types of activities of energy consulting companies.
In order to assess the impact on the Russian energy market and identify potential effects from the implementation of NILM technologies, it is necessary to answer a number of questions:
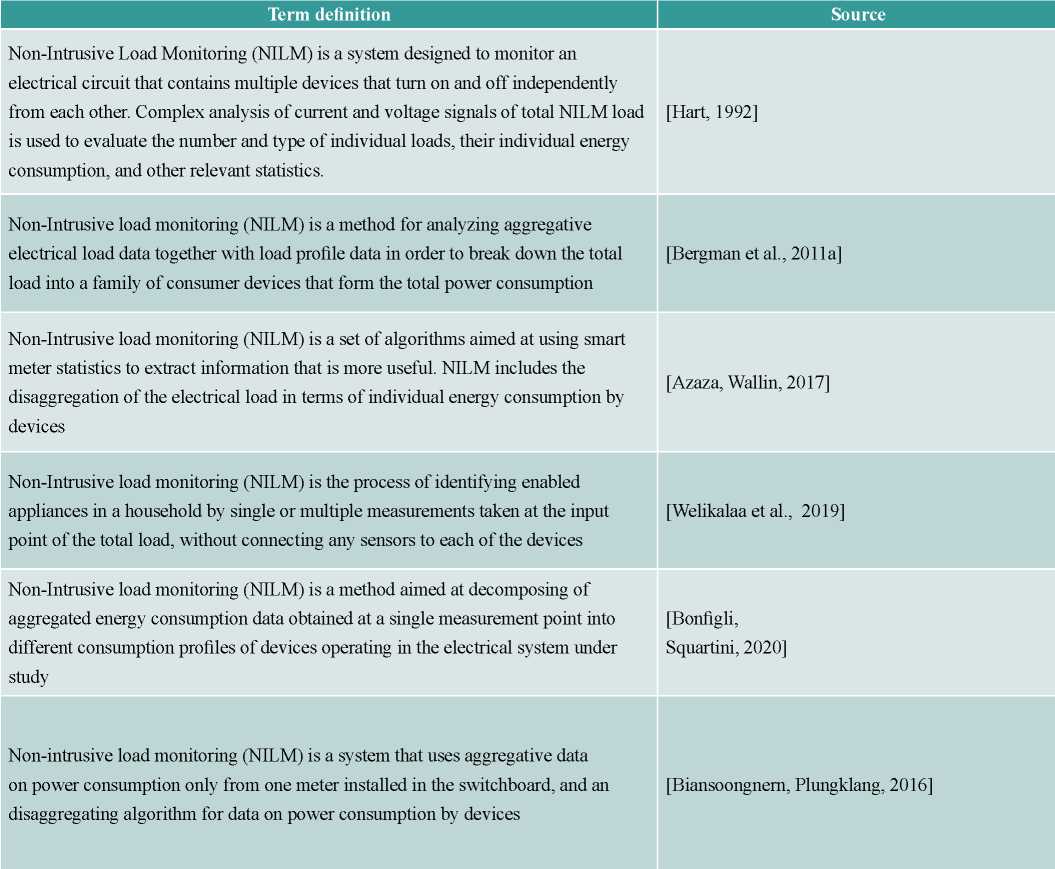
Before proceeding to a more detailed consideration of the technological aspects, it is necessary to form a unified view of the NILM in this work. A number of definitions have been compiled for this purpose, as shown in tabulation 1.
Tabulation 1
Definition of the "non-intrusive load monitoring" term
Two distinctive features of non-intrusive load monitoring technology follow from the definition analysis:
Non-intrusiveness. In contrast to the current intrusive load monitoring implemented using direct-on counters, WiFi sockets, and GSM sockets, the NILM sensor measures current and voltage at one point in the building's electrical distribution network and does not require direct connection to the network [Cox, 2006]. At the same time, the NILM sensor provides the necessary measurement accuracy at a significantly lower cost of connection resources: only one meter per building is needed, and its installation and disassembly do not cause difficulties [Naghibi, Deilami, 2014].
Disaggregation of data. To get the load profiles of each device in a building, an intrusive metering device must be installed at the input of each device. The NILM sensor solves this problem by decomposing aggregated energy consumption data obtained at a single measurement point into different device consumption profiles. Significant cost savings on building equipment are already achieved at the household level [Naghibi, Deilami, 2014].
In large buildings, as well as in factories with a large amount of equipment, the installation and subsequent maintenance of traditional metering devices become critically expensive, since the number of meters will be directly proportional to the number of equipment at production. Thus, the high cost of solutions based on intrusive metering tools also encourages the development of non-intrusive load monitoring technologies [Cox et al., 2007].
A schematic diagram of load disaggregation is shown in Fig. 2.
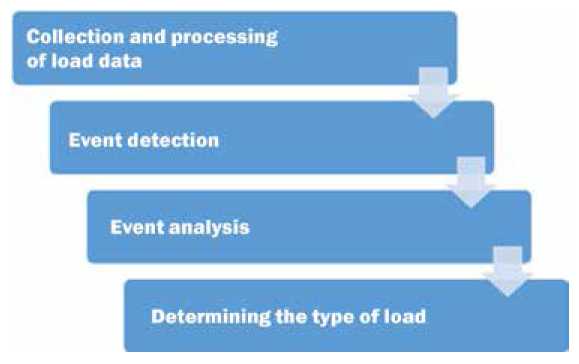
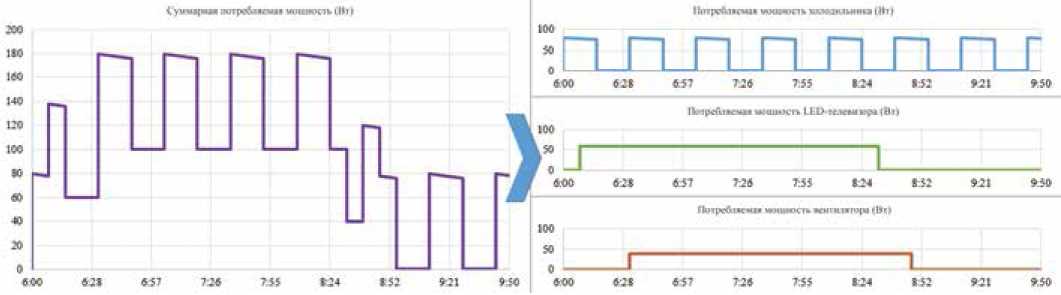
First, the sensor collects data at a given frequency in order to form a total load profile. Following the data collection, the primary information is sent to the NILM data processing center (DPC), where it is pre-processed. Then, by changing the signal profile, an event that occurred due to turning the device on or off in the building is detected. Using cloud computing and big data analysis technologies, NILM analyzes an event and identifies a single device with further highlighting its power consumption profile (Fig. 3) [Bergman et al., 2011]. The collected information (either from one or several sensors) is systematized by the data processing center and presented to the user in the form they need (for example, on an online platform or in a mobile app).
Thus, NILM is a promising method to identify individual devices, determine their power consumption and work schedules. Tabulation 2 shows the main types of devices that can be recognized using NILM:
Tabulation 2
The main types of detected devices [Zoha et al., 2012]
 Source: [Zoha et al., 2012].
The information collected by the NILM sensor has a wide range of applications in the field of electric power, including the provision of the detailed report to the consumer on the use of electricity and the contributions of various devices to total energy consumption, as well as generating electricity bills broken down by consumer devices; measuring and verifying the energy efficiency of buildings; improved forecasting of demand profiles; developing programs for cost-dependent
demand management; collecting data for building digital duplicates and models. Behavior patterns of the NILM sensor owner, including occupation, sleep mode, and other elements of daily life, can also be obtained from data, collected when using the sensor [McKenna et al., 2012].
The accuracy of total load measurement with the NILM sensor is second to none in traditional power metering systems. In turn, the accuracy of load disaggregation continues to improve permanently, but to date it has not reached 100%. However, there is no significant difference for potential users whether the accuracy is 95% or 98%. More significant are innovative ways to use the data obtained, as well as previously non-existent business models based on them. Examples of practical implementation can include both the development of personalized demand management strategies based on energy consumption data, and the formation of energy consumption forecasts at the scale of large power systems [Zhuang et al., 2018]. Some promising applications of NILM will be discussed later.
Disaggregation of total energy consumption and visualization. Users can determine the energy consumption of each device using the NILM sensor. The analysis result can be presented in the user application or in the personal account of the online system in the form of interactive infographics. The amount of useful information can be significantly increased by installing several sensors (for example, to get the distribution of energy consumption by floors in a highrise building or data on the loading of machines in various workshops of a large enterprise).
Detection of abnormal operating modes of devices and prevention of breakdowns. Sensors collect real-time statistics on the device's operating modes. Specialized machine learning algorithms are able to recognize changes in the operating mode and notify the user of a failure in a timely manner.
Splitting the invoice for electricity consumed. Load disaggregation allows to divide the electricity bill by the main sources of consumption. If the cost of electricity is different for different times of day, it is possible to compose a report on the operating cost of the device at a certain time interval. This function opens up a wide range of opportunities for optimizing energy costs and generating schedules for efficient energy consumption.
Integration with third-party products. Load disaggregation is one of the key features of NILM. Its advantages can also be implemented using third-party electricity meter producers. The hardware component can be integrated into counters, vending machines, and third-party sensors to send data to the NILM data processing center and then process the information.
Sending alerts and notifications. Using the online service, the NILM system is able to notify the user about critical situations that have occurred or on completion of user's set conditions (for example, if the power consumption exceeds the set value or if the refrigerator door was left open).
The introduction of technological innovations is considered effective if they lead to a positive economic effect [Transformation..., 2018]. Analysis of sources from the list of NILM Wiki has shown that the integrated implementation of NILM technology can provide a significant economic effect [NILM Wiki..., [no date]]. In addition, data from ATS JSC, analytical reports from the Centre for strategic studies, and materials from Mosenergosbyt JSC were used to assess the effects on the Russian electricity market.
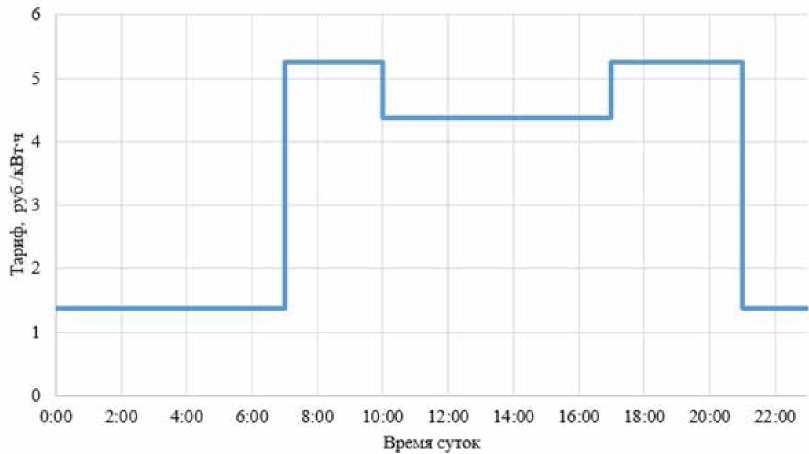
Effect on households. Load disaggregation will allow to study in detail the power consumption of each device available in the house. For those who want to save money, it becomes possible to identify the devices that make the greatest contribution to the final energy consumption: this information can help the user to make a decision about replacing inefficient electrical appliances.
If the user pays for electricity using a tariff differentiated by time zones, it is possible to optimize the energy consumption plan and reduce the monthly bill (Fig. 4).
The fault monitoring system is able to assess the condition of the devices in real time and issue alerts in case of a fault. Preventive repairs can be significantly cheaper than purchasing new equipment in the case of a breakdown.
Also, by means of disaggregation, it is possible to easily identify the facts of extraneous interference in the distribution board of the house and prevent non-contractual consumption.
Using an online service or a user app, the sensor owner can choose which notifications they want to receive.
Aapproximate list of notifications:
The notification system also allows to organize parental control and monitoring of elderly relatives.
These effects can engage the user in monitoring and analyzing their load, as well as contribute to the rationalization of energy consumption by the population.
Industrial enterprises and large commercial buildings. For industry and large commercial buildings, the division of energy consumption has a significantly greater economic effect than for households. The above advantages of disaggregating and data analysis on consumption profiles become even more relevant due to the wider range of pricing (table 3, figure 5).
Tabulation 3
Price categories of unregulated prices for electric energy (capacity)
Source: [Mosenergosbyt JSC, [no date]]
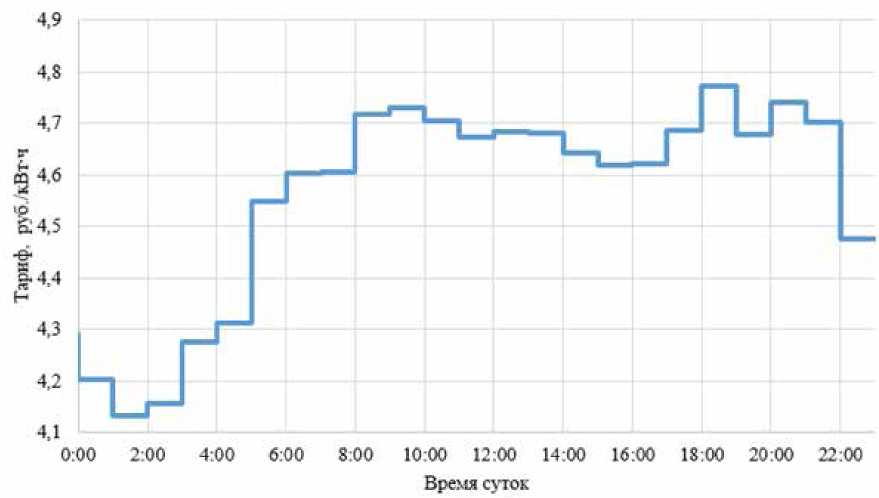
Statistical data collected by the NILM sensor allows us to determine the most effective energy consumption plan and reasonably choose the pricing tier that will be the most profitable for the consumer.
It should be noted that for most large buildings, significant load management potential is contained in the climate and lighting equipment, which is a significant part of the total load. Many shopping centers and offices make a practice of reducing the power of lighting during peak consumption hours. It is also possible to configure the cycles for turning climate equipment on and off so that the operating period does not coincide with peak consumption hours. Climate characteristics have a significant inertia, which allows them to be particularly flexible in optimizing the energy consumption mode.
The installation of several sensors, united with a single online system, will allow allocating of energy consumption by floors, rooms, or groups of equipment, depending on the power supply scheme of the building. For large property owners, this will make possible to charge reasonable electricity fees to tenants. Tenants, in turn, can also optimize the cost of electricity supply. For industrial enterprises, it becomes possible to analyze the workload of equipment and workshop premises in order to further improve the operational efficiency of the enterprise.
The ability of NILM to monitor equipment operation and perform preventative accounting is important for factories. Businesses can save significant amounts of money with low costs for preventive monitoring, avoiding failures. For example, there is a possibility to identify the damage of cable winding in electric motors [Das et al., 2014]. The works [Cox, 2007; Nation, 2017] demonstrate an example of using the NILM system for monitoring the operating modes of gas turbine engines and generators.
The function of preventive monitoring is particularly important for continuous production cycle enterprises, where the production stoppage due to unforeseen breakdowns can lead to the loss of fixed assets.
Management companies and housing and communal services. The data generated by the NILM online system will allow to analyze the cost of general household needs by type of load and make the house more energy efficient. The implementation of NILM will also make it much easier to detect illegal connections to the networks of general household needs and counteract theft of electricity.
The previous paragraphs described small NILM sensor systems - from one (in the case of a population) to a dozen (in the case of an enterprise or commercial building). Companies in the power industry are able to integrate NILM sensors into large systems that are united into statistical data exchange platforms. Big data of this kind can be widely used in a number of energy companies.
Electric grid company. The implementation of the NILM system in the activities of power grid companies opens up opportunities for predictive informing about equipment failures.
Automated data collection will simplify the reconciliation of energy balances, increase the effectiveness of counteracting unaccounted consumption, and reduce the volume of commercial and technological losses.
Power supply companies. The big data of the NILM system will allow us to predict with greater efficiency the load generated by consumers, which will increase the efficiency of power supply companies in the wholesale electricity and capacity market.
Data analysis from a large sample of consumers will allow to develop recommendations on optimization of the intra-day load schedule for each consumer, helping them to achieve maximum savings.
Authorities and regulators. For industry authority bodies and regulators the analysis of NILM large data will optimize the decision-making concerning the future development of the electricity sector through investment programmes in matters of pricing and tariff, as well as the formation of energy efficiency programs.
In addition to improving the efficiency of electric power companies in their current paradigm, the NILM technology can serve as a powerful tool for implementing completely new concepts.
Building an smart grid. NILM technology can become one of the key technologies at implementing smart grids. Smart grid energy management is the basis for implementing demand management, integrating stochastic generators using renewable energy sources, and storage systems. However, modern concepts of smart grids emphasize the management of stochastic generation and storage, while underestimating the potential for flexibility on the consumer side. NILM technology is able to provide all the required volume of information to manage generating and consumption modes within the intelligent network. The work [Zaidi et al., 2010] shows that the NILM system can automatically detect the pattern of load behavior and use it to set the optimal operation mode of intelligent network elements. The NILM technology can be used to obtain information of required accuracy in order to control the operating modes of devices in a hybrid DC and AC network [Huang et al., 2016]. The work [Zhang et al., 2011] examines the adaptation of NILM technology to identify the charging of an electric vehicle accumulator in the intelligent network.
Demand management. Demand management is an incentive system for end-users to voluntarily change the schedule of electricity consumption without additional regulation by the subject of operational dispatch management and for savings resulting from such a reduction in consumption. In addition to maneuverable generating, demand management is a significant source of flexibility in the power system, i.e. the ability to maintain a power balance in the conditions of rapidly changing consumption power and stochastic generation power.
However, currently there are no sufficiently accurate models to assess the potential for demand management. By analyzing user load profiles, the NILM system can identify devices with high potential as part of demand management.
In recent years, an increasing number of researchers have devoted themselves to the study of demand response based on NILM. High-precision comparative analysis of demand management participants allows us to build new price models based on determining prices for each group of consumers involved in demand management, thereby maximizing their benefits [Lin, Wang, 2011]. Incentive demand management programs allow the subject of operational dispatch management to involve new participants, and NILM, in turn, significantly simplifies the verification of load reduction, which is especially important for monitoring the performance of demand management responsibilities in the private sector [Bergman, 2011].
Significant demand management potential is concentrated in the hands of medium and small consumers in the retail market, as well as in the private sector. The low cost, ease of installation and intuitive understandability of user app of the NILM sensor will help to popularize demand management among consumers and involve them in it.
Energy consulting. The wide range of functions of the NILM sensor extends such activities as energy consulting. Due to non-intrusiveness, NILM sensors can be easily installed on the power supply system of the object under study, and after data is being collected they can be also easily dismantled. The collected data will allow to:
The list shows the main directions of data collected by the sensor. The NILM technology is quite flexible and can be adapted to non-standard situations and requirements of the energy audit customer.
Commercial use of data. As has already been stated, the NILM sensor owner's daily routine, including occupation, sleep mode, and other elements of daily life, can also be obtained from data, collected when using the sensor [McKenna et al., 2012].
This information can be applied in non-energy-related areas, such as commercial services (customer profiling, targeted marketing), legal services (curfew monitoring), and remote health care (monitoring of elderly people living at home) [Devlin et al., 2018].
Thus, a completely new type of business opens up for an electric power company using NILM technology – the use of data for commercial purposes.
The process of spreading innovation through market and non-market channels among different consumers over time is called "diffusion of innovation" [Oslo Manual..., 2006].
In this article, the diffusion model proposed by F. Bass [Bass, 1969] will be used to predict the rate of distribution of NILM technology among private users.
The Bass model, as well as its subsequent modifications, is based on taking into account both "innovators" who accept the innovation independently and influence potential buyers in the future, and "imitators" who accept the innovation under the influence of innovators who are already using the technology [Trachuk, Linder, 2017].
The Bass model allows us to describe a wide range of products - from highly specialized technological solutions to everyday household goods such as washing machines, dishwashers, and cell phones. This model is also able to characterize completely different industries [Bass et al., 1994].
This model is widely used in forecasting, especially in predicting the introduction of new products and technologies to the market, the actual distribution data of which has not yet been collected. To evaluate the model parameters, we use information about products that are already sold on the market and have a number of characteristics similar to the product under study.
It should be noted that, despite the effectiveness of the model for predicting the diffusion of durable products (air conditioners, televisions, video surveillance systems, smart home equipment, etc.) [Bass, 2004; Bass et al., 1994], the Bass model does not exclude possible errors and uncertainties due to the use of evaluative dimensions in the construction.
The Bass model in discrete form shall be formulated as:

where n (t) – the number of consumers who accepted the innovation at the time t; N (t – 1) – the total number of consumers who accepted the innovation during the previous period (t – 1); M – market potential; p – innovation coefficient; q – simulation coefficient; n(t)инн – the number of innovators who accepted the innovation at a time t; n(t)им – the number of imitators who accepted the innovation at a time t.
The first term in formula (1) corresponds to the contribution of innovators to the number of purchases at a given time t and is proportional to the number of users who have not yet purchased the innovation, i.e. the multiplier (M – N (t – 1)). In turn, the contribution of imitators is proportional to both the number of consumers who have not yet made a purchase, and the share of users who have already
purchased the innovation – 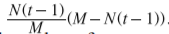
In discrete form, the total number of consumers who have accepted the innovation is expressed by the formula:
N(t) = N(t-1) + n (t), (2)
where N(t) is the total number of consumers who accepted the innovation.
For convenience of further calculations, expression (1) is converted to the form:
 (3)
(3)
The Bass mathematical model can also be represented in continuous form:
 (4)
(4)
The solution of the differential equation (4) allows us to express a number of useful relations [Bass, 1969]:
 (5)
(5)
 (6)
(6)
In the case of p < q the curve N(t) has a S-shape with an inflection point T*, defined by the ratio:
 (7)
(7)
It is important to note that the point T* in the case of p < q is defined as the extreme point of the curve n(t), that is, it is the point of the sales peak.
The definition of the parameters M, p and q. NILM technology has a wide range of applications: from households and office buildings to industrial production. In this regard, it was decided to normalize the market potential M to 100% in order to describe the process of technology distribution.
Since the model is often used to describe the distribution process of a product that has not yet been released to the market, there is no actual data on p and for q the NILM technology. In this regard, it was decided to use the parameters of other products with similar market characteristics, whose coefficients p and q are known.
The following digital solutions were selected to evaluate the coefficients p and q of NILM technology: a cloud platform for video surveillance, a service for collecting customer contact information, a product for protecting personal and corporate data for mobile devices used for work in the office and at home, and a smart home system. For the NILM technology, the weighted average value p = 0,022, q = 0,323 (table 4).
Tabulation 4
Estimation of p and q parameters for the NILM technology

Source: [Churkin, 2013]
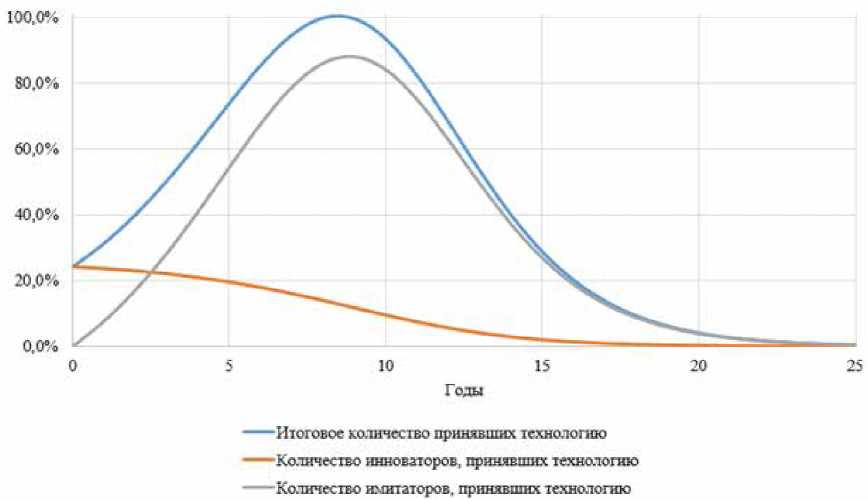
Calculation result. The spread of NILM technology was predicted using (1) and (2) formulas. In Fig. 6, 7 and from table 5 it can be seen that the speed of the NILM technology distribution increases in the first eight years, after which it begins to decrease. A significant amount of market potential will be exhausted by the fifteenth year after the start of sales.
Tabulation 5
Forecast of the NILM technology distribution
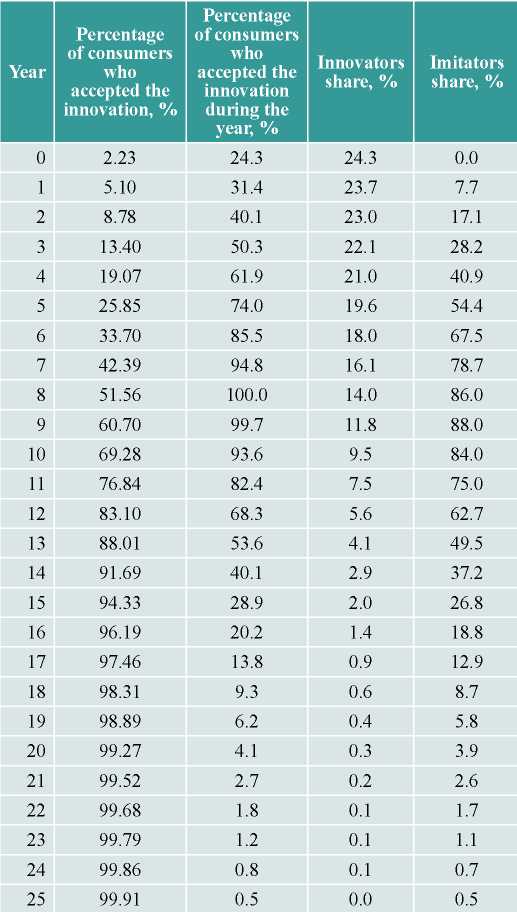
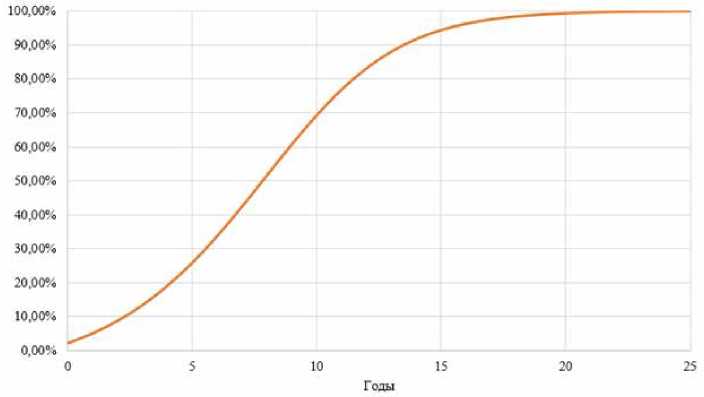
Innovation coefficient p is lower than simulation coefficient q. In this case, the graph of the dependence of the consumers number who accepted the innovation at time t, from time will have a maximum point corresponding to the sales peak. According to the calculation, the peak of sales will come in the eighth year.
Calculations have shown that the speed of distribution of the NILM technology is low. Eight years before the peak of sales is a significant period in the era of the fourth industrial revolution, when the pace of technological evolution is quite high and continues to grow. Technology corridors can significantly accelerate the spread of NILM technology.
In Russia, the term "technological corridor" usually refers to a number of requirements and restrictions imposed by the state on the technical parameters of applied technologies, consumer products and services.
Technology corridors have significant potential to accelerate the spread of technologies, stimulate research and development, and displace outdated technologies [Stepuro, 2017].
Electric power companies can also help accelerate the spread of NILM technology by systematically introduction of NILM sensors. For example, new buildings may be equipped with them, or if NILM sensors are installed during the replacement of electricity meters in already built buildings.
The article considers the concept and various ways of using non-Intrusive load monitoring technology. Despite the consensus in the interpretation of the key elements and functions of NILM, due to the flexibility and ease of scaling, researchers identify a wide range of activities that affect energy consumption in one way or another, where the technology can be used.
Key ways of applying NILM in practice were formed and potential effects from implementation were identified. Non-intrusive load monitoring can bring benefits to endusers, improve the efficiency of companies in the power industry, and serve as a powerful driver for the development of completely new patterns in the power industry.
The pace of distribution of NILM technology predicted using the Bass model indicates the need to use technological corridors and systematic implementation of the technology by energy companies to accelerate its adoption and approach the peak of sales.
As a further study of NILM, it is interesting to study more deeply each direction of implementing non-intrusive monitoring, as well as the formation and evaluation of effects for various participants in the electricity market. Another promising area of research is the integration of NILM sensors with "non-electrical" sensors (such as temperature, humidity, light, etc.) and actuators.
1. AO “Mosenergosbyt” (b.g.). URL: https://mosenergosbyt.ru.
2. Edinaya energeticheskaya sistema Rossii (2019). Sistemnyy operator Edinoy energeticheskoy sistemy (AO “SO EES”). URL: https://yearbook.enerdata.net / electricity / world-electricity-production-statistics.html.
3. Linder N. V., Lisovskiy A. L. (2017). Razvitie rynka elektroenergii v Rossii: osnovnye tendentsii i perspektivy. Strategii biznesa, 2, 48–54.
4. Linder N. V., Trachuk A. V. (2017). Vliyanie perekrestnogo subsidirovaniya v elektro- i teploenergetike na izmenenie povedeniya uchastnikov optovogo i roznichnogo rynkov elekro- i teploenergii. Effektivnoe аntikrizisnoe upravlenie, 2, 78–86.
5. Rasporyazhenie Pravitel’stvaRF ‘Ob utverzhdenii Strategii razvitiya elektrosetevogo kompleksa Rossiyskoy Federatsii’ ot 03.04.2013 № 511‑r. rosseti.ru. URL: https://www.rosseti.ru / about / mission / 511_R.pdf.
6. Stepuro Ya. R. (2017). Tekhnologicheskie koridory kak instrument uskoreniya diffuzii innovatsiy na primere tekhnologii platezhnykh kart. Strategii biznesa, 7. URL: https://cyberleninka.ru / article / n / tehnologicheskie-koridory-kak-instrument-uskoreniya-diffuzii-innovatsiy-na-primere-tehnologii-platyozhnyh-kart.
7. Trachuk A. V., Linder N. V. (2017). Rasprostranenie instrumentov elektronnogo biznesa: rezul'taty empiricheskogo issledovaniya. Rossiyskiy zhurnal menedzhmenta, 2017, 1, 27–50.
8. Trachuk A. V., Linder N. V., Tarasov I. V., Nalbandyan G. G., Khovalova T. V., Kondratyuk T. V., Popov N. A. (2018). Transformatsiya promyshlennosti v usloviyakh chetvertoy promyshlennoy revolyutsii. Monografiya. Saint Petersburg, Real'naya ekonomika, 2018.
9. Khovalova T. V. (2017). Modelirovanie effektivnosti perekhoda na sobstvennuyu generatsiyu. Effektivnoe аntikrizisnoe upravlenie, 2017, 3, 44–57.
10. Khokhlov A., Melnikov Yu., Veselov F., Kholkin D.,
11. Datsko K. (2018). Raspredelennaya energetika v Rossii: potentsial razvitiya. Skolkovo. URL: https://energy.skolkovo.ru / downloads / documents / SEneC / Research / SKOLKOVO_EneC_DER-3.0_2018.02.01.pdf.
12. Tsifrovoy perekhod v elektroenergetike (2017). Tsentr strategicheskikh razrabotok. URL: https://www.csr.ru / issledovaniya / tsifrovoj-perehod-velektroenergetike-rossii / .
13. Churkin V. I. (2013). Prognoz prodazh innovatsionnykh tovarov s uchetom makroekonomicheskikh faktorov (na primere malykh vetrogeneratorov). Nauchno-tekhnicheskie vedomosti SPbGPU. Ekonomicheskie nauki, 2013, 1–1, 104–112. URL: https://cyberleninka.ru / article / n / prognoz-prodazh-innovatsionnyh-tovarov-s-uchetom-makroekonomicheskih-faktorov-na-primere-malyh-vetrogeneratorov.
14. Shvab K. (2016). Chetvertaya promyshlennaya revolyutsiya. Moscow, Eksmo, 2016.
15. Energeticheskaya strategiya Rossii na period do 2030 goda. Ministerstvo energetiki RF. URL: http://minenergo.gov.ru / aboutminen / energostrategy.
16. Azaza М., Wallin F. (2017). Finite state machine household's appliances models for non-intrusive energy estimation. Energy Procedia, 105, 2157–2162. DOI: https://doi.org / 10.1016 / j.egypro.2017.03.609.
17. Bass F. M. (1969). A new product growth model for consumer durables. Management Science, 15 (5), 215–227.
18. Bass F. M. (2004) Comments on a new product growth for model consumer durables. Management Science, 50 (12), 1833–1840.
19. Bass F. M., Trichy K., Jain D. C. (1994). Why the Bass
20. model fits without decision variables. Management Science, 13 (3), 203–223.
21. Bergman D. C., Jin D., Juen J. P., Tanaka N., Gunter C. A. (2011a). Distributed non-intrusive load monitoring. IEEE Xplore. Conference: Proceedings of the 2011 IEEE. PES Conference on Innovative Smart Grid Technologies (ISGT). URL: https://ieeexplore.ieee.org / document / 5759180.
22. Bergman D. C., Jin D., Juen J. P., Tanaka N., Gunter C. A., Wright A. K. (2011b). Non-intrusive load shed verification. IEEE Pervasive Comput., 10 (1), 49–57.
23. Biansoongnern S., Plungklang B. (2016). Non-intrusive appliances load monitoring (nilm) for energy conservation in household with low sampling rate. Procedia Computer Science, 86, 172–175. DOI: https://doi.org / 10.1016 / j.procs.2016.05.049.
24. Bonfigli R., Squartini S. (2020). Machine learning approaches to non-intrusive load monitoring. Springer.
25. Cox R. W. (2006). Minimally intrusive strategies for fault detection and energy monitoring. PhD Dissertation. EECS, MIT, Aug.
26. Cox R. W., Bennett P. L., McKay T. D., Paris J., Leeb S. B. (2007). Using the non-intrusive load monitor for shipboard supervisory control. IEEE Electric Ship Technologies Symposium. DOI: https://doi.org / 10.1109 / ests.2007.
27.
28. Das S., Purkait P., Koley C., Chakravorti S. (2014). Performance of a load-immune classifier for robust identification of minor faults in induction motor stator winding. IEEE Trans. Dielectr. Electr. Insul., 21 (1), 33–44.
29. Devlin М., Hayes B. (2018). Non-intrusive load monitoring using electricity smart meter data: a deep learning approach. researchgate.net. DOI: https://doi.org / 10.13140 / RG.2.2.29463.42402.
30. Freeman C., Clark J., Soete L. (1982). Unemployment and technical innovation: a study of long waves and economic development. London, Frances Printer.
31. Global Energy Statistical Yearbook (2019). URL: https://yearbook.enerdata.net / electricity / world-electricity-production-statistics.html.
32. Hart G. W. (1992). Nonintrusive appliance load monitoring. Proceedings of the IEEE, 80, 1870–1891.
33. Huang Z., Zhu T., Gu Y., Li Y. (2016). Shepherd: Sharing energy for privacy preserving in hybrid aC-dC microgrids. Proceedings of the 7th International Conference on Future Energy Systems, 202–211.
34. Kempener R., Komor P., Hoke A. (2013). Smart grids and renewables. A guide for effective deployment. International Renewable Energy Agency. URL: https://www.irena.org / documentdownloads / publications / smart_grids.pdf.
35. Lin C., Wang Z. (2016). A new DSM energy-pricing model based on load monitoring system. Proceedings of the 2nd International Conference on Artificial Intelligence. Management Science and Electronic Commerce, AIMSEC, 3650–3653.
36. McKenna E., Richardson I., Thomson M. (2012). Smart meter data: Balancing consumer privacy concerns with legitimate applications. Energy Policy, 41, 807–814.
37. Naghibi B., Deilami S. (2014). Non-intrusive load monitoring and supplementary techniques for home energy management. Australasian Universities Power Engineering Conference (AUPEC). DOI: https://doi.org / 10.1109 / aupec.2014.6966647.
38. Nation J.C., Aboulian А., Green D., Lindahl P., Donnal J., Leeb S.B., Bredariol G., Stevens K. (2017). Nonintrusive monitoring for shipboard fault detection. SAS 2017–2017 IEEE Sensors Appl. Symp. Proc.
39. NILM Wiki. http://wiki.nilm.eu.
40. Oslo manual: guidelines for collecting and interpreting innovation data (2005). The measurement of scientific and technological activities. OECD, European Communities. URL: https://www.oecd-ilibrary.org / docserver / 9789264013100‑en.pdf?expires=1581589090&id=id&accname=guest&checksum=28EB099C3721F16E2E70711CD4252391.
41. Freeman C., Soete L. (eds.). Technical change and full employment (1987). Oxford, Basic Blackwell.
42. U. S. Patent 4,858,141. Non-intrusive appliance monitor apparatus (1989). patents.google.com. URL: https://patentimages.storage.googleapis.com / 04 / a6 / 39 / 62cb653df35111 / US4858141.pdf.
43. Welikalaa S., Thelasinghaa N., Akrama M., Ekanayakea P. B., Godaliyaddaa R. I., Ekanayakea J. B. (2019). Implementation of a robust real-time non-intrusive load monitoring solution. Applied Energy, 238, 1519–1529. DOI: https://doi.org / 10.1016 / j.apenergy.2019.01.167.
44. Zaidi A. A., Zia T., Kupzog F. (2010). Automated demand side management in microgrids using load recognition. IEEE International Conference on Industrial Informatics (INDIN), 774–779.
45. Zhang P., Zhou C., Stewart B. G., Hepburn D. M., Zhou W., Yu J. (2011). An improved non-intrusive load monitoring method for recognition of electric vehicle battery charging load. Energy Procedia, 12, 104–112.
46. Zhuang M., Shahidehpour M., Zuyi L. (2018). An overview of non-intrusive load monitoring: Approaches, business applications, and challenges. Conference: 2018 International Conference on Power System Technology, 4291–4299. DOI: https://doi.org / 10.1109 / POWERCON.2018.8601534.
47. Zoha A., Gluhak A., Imran M., Rajasegarar S. (2012). Nonintrusive load monitoring approaches for disaggregated energy sensing: а survey. Sensors, 12, 16838–16866.
Specialist of the Department of Economic Planning and Contract Relations, Sintez Grupp CJSC.
Research interests: strategies and development management of companies in the electric power industry, introduction of innovations in the electric power industry, efficiency of energy companies.
Kuzmin P.S. NON-INTRUSIVE LOAD MONITORING: IMPLEMENTATION EFFECTS AND DISTRIBUTION PROSPECTS. Strategic decisions and risk management. 2019;10(4):306-319. https://doi.org/10.17747/2618-947X-2019-4-306-319
Ligovsky av 73, of.401, Saint Petersburg, 190040, Russia
Tel.: +7 (812) 346-50-15 (16)
Real Economy Publishing House.
E-mail: info@jsdrm.ru
Registration certificate PI No. FS-77 - 72389 from 02.28.2018, issued by the Federal Service for Supervision in the Sphere of Communications, Information Technologies and Mass Communications.
Processing of personal data


