


Contents
Scroll to:
https://doi.org/10.17747/2618-947X-2019-2-156-165
Scroll to:
A multifactor mathematical model for analyzing and evaluating the competitiveness of socio-economic systems has been developed. A review of the definitions of the concept of competitiveness used by various international institutions. According to the results of the review, the concepts of competitiveness, used in the present work, were formulated to identify the factors affecting it. A methodology for assessing competitiveness has been developed based on the analysis of the influence of four factors on it, characterized by 32 statistical indicators and corresponding significance indices. For the practical implementation of this technique developed a mathematical model. We analyzed the competitiveness of six regions of the Federation, representing six federal districts. The main directions of improving competitiveness for each subject of the Federation.
Abdikeev N.M., Bogachev Yu.S., Losev A.A., Tolkachev S.A. MULTIVARIATE MODEL OF ANALYSIS AND ASSESSMENT OF THE COMPETITIVENESS OF SOCIO-ECONOMIC SYSTEMS. Strategic decisions and risk management. 2019;10(2):156-165. https://doi.org/10.17747/2618-947X-2019-2-156-165
In the context of the transition of the economies of leading countries to the sixth technological order in the expert community, the concept of socio-economic systems (hereinafter - SES) competitiveness is being revised.
Currently, international institutions in determining competitiveness focus on the ability of SES to contribute to improving the quality of life of the population and the development of civil society (Aiginger, 2014).
The World Economic Forum defines national competitiveness as the ability of a country and its institutions to achieve stable economic growth rates that are sustainable in the medium term (World Economic Forum, 2018).
According to the definition of the European Competitiveness Advisory group, competitiveness is the basis for raising living standards, providing jobs for the unemployed and eradicating poverty.
In modern conditions, the engine of economic growth and sustainable development of SES is the manufacturing industry due to the advanced development of its high-tech sectors (UNIDo, 2013).
Generalizing, we define the competitiveness of SES as the ability to contribute to improving the quality of life of the population based on the formation of competitive advantages in the domestic and foreign markets through the advanced development of high-tech manufacturing sectors in the digital economy.
In modern conditions, when the world economy moves to a new technological structure and the processes of its digitalization are actively going on, it is necessary to assess the adequacy of the existing SES models (raw materials, investment and innovation), the possibility of forming competitive advantages within their framework for solving the main socio-economic problems on the basis of innovative development.
When choosing the innovative development model, it is necessary to take into account the level of its socio-economic condition. For example, with weak technological and economic development, the introduction of new technologies can lead to higher unemployment and thus lower quality of life (UNIDo, 2018).
Macroeconomic indicators and indicators of social development level determine socio-economic status. It should be borne in mind that the economic efficiency of economic entities determines their susceptibility to the introduction of new technologies and the ability to form a competitive advantage in the sale of products in the markets.
The main driver of socio-economic development is the human factor (Sadovnichiy, Akaev, 2013). in this regard, it is important to assess the quality of the functional effectiveness of scientific and technical, innovation, business and management environment at different levels in solving the problems of formation of a stable and balanced economic system.
The next limiting factor in the development of the SES economy is the underdevelopment of transport, information and communication infrastructure. This largely determines the costs of promoting products on the market and, ultimately, the competitiveness of products in the domestic and foreign markets.
Thus, we identify four main factors that determine the competitiveness of SES in the conditions of digitalization: macroeconomic, social, infrastructural and innovative- technological.
Each factor affects the economy in different directions.
Each direction of impact is characterized by a certain set of indicators.
Let us consider the characteristics of the impact on the economy of these factors.
1. Macroeconomic factor. The main directions of the impact of the macroeconomic factor on the economy are the level of economic development; efficiency of economic activity; the importance of manufacturing in the SES economic model; investment development potential.
Let us consider the characteristics of the impact of this factor in each of the above areas:
1.1. The level of economic development is characterized by indicators:
1.1.1. “SES gross product per capita”, in rubles;
1.1.2. The degree of depreciation of fixed assets as a whole at the end of the year, %.
1.2. The importance of the manufacturing industry is characterized by the following indicators:
1.2.1. Share of manufacturing industry in SES value added, % to total, in current basic prices;
1.2.2. The average annual number of employed in manufacturing, in thousand people;
1.2.3.The degree of depreciation of fixed assets in manufacturing at the end of the year, in %.
1.3. The investment potential is characterized by indicators:
1.3.1. Index of physical volume of investments in fixed capital;
1.3.2. The share of investments in machinery, equipment, vehicles, % of total investment.
1.4. The efficiency of economic activity is characterized by the indicator:
1.4.1. Balanced financial result (profit minus loss) of SES, mln RUB.
When analyzing the impact of macroeconomic factors on the economy, it is necessary to assess:
2. Social factor. Let us consider the direction of the influence of the social factor on the economy; whereby it is necessary to take into account the potential of social tension, the level of health care development and the development of the economy communal sector.
2.1. The potential of social tension is characterized by two indicators:
2.1.1. The level of economic prosperity of the population - the ratio of the average monthly salary of employees of organizations with the value of the subsistence minimum, %;
2.1.2. The share of public spending on the purchase of goods and services, % of total monetary income. This indicator characterizes the ability of the population to improve the quality of their lives.
2.2. The level of health development is characterized by indicators:
2.2.1. The burden on health workers - the population per doctor at the end of the year, person. The indicator characterizes the availability of public health services;
2.2.2. Mortality of the population of working age - the number of deaths per 100000 people of the corresponding age. The indicator characterizes the quality of health care.
2.3. The level of development of the municipal sector of the economy is characterized by the following indicator:
2.3.1 The total area of residential premises, falling on average per inhabitant at the end of the year, m2. This indicator characterizes the potential of social tension caused by the underdevelopment of the public service sector.
When analyzing the social factor, it is necessary to assess the level and diversification of the population's demand for innovative products, the level of population's provision with quality medical and public services.
3. The innovation and technological factor determines the tools and directions of economic development through large-scale technological development. This factor affects the economy in the directions, united in five groups. Due to the special importance of this factor for socio-economic development, increase in labor productivity and technological modernization of the national economy, each group is assigned a level of importance.
This factor determines the level of development of the scientific and technological sphere and the attitude of the business community to the innovative development of the economy.
3.1. Innovation and resource potential (IRP) - significance factor of 15%. This group includes indicators characterizing intellectual, organizational and financial resources of innovative development of the economy.
3.1.1. Level of scientific and technical development - the number of personnel engaged in research and development in the average annual number of employed in the economy, %.
3.1.2. The share of research and development costs as a percentage of GRP, %.
3.2. The attitude of the business community to the innovative development of the economy. In this group, there are indicators that characterize the importance of innovation for economic activity. Significance factor - 15%.
3.2.1. The importance of innovation for economic activity - the share of the cost of technological innovation in the total volume of goods shipped, work and services performed, %.
3.2.2. The share of organizations that carried out technological innovations in the total organizations (industrial production organizations), %.
3.3. The index of manufacturing industry digitalization - significance factor of 20%. This group includes indicators characterizing the use of software in solving problems of management, design and training.
3.3.1. The use of special software to control automated production.
3.3.2. The use of special software for design.
3.3.3. The use of special software - CRM, ERP, SCM systems.
3.3.4. Training programs
3.4. The business model transformation index - significance factor of 20%. In this group, there are indicators that characterize the use of special software in financial arrangement, monitoring, solving information problems and support of operating activities.
3.4.1. Organizations that used special software to solve organizational, managerial and economic problems.
3.4.2. Organizations that used special software to conduct financial arrangement in electronic form.
3.4.3. Organizations that used special software to provide access to databases through global information networks.
3.4.4. Electronic reference and legal systems.
3.4.5. Organizations that used electronic data exchange between their own and external information systems in exchange formats.
3.5. The effectiveness of innovation and technological activity - significance factor of 30%. The set of indicators of this group characterizes the effectiveness of innovation to solve the problems of technological modernization of product and process innovation.
3.5.1. The number of developed advanced production technologies for 10 thousand people, employed in the economy, %.
3.5.2. The number of used advanced production technologies for 10 thousand people, employed in the economy, %.
3.5.3. The share of innovative goods, works, services in the total volume of goods shipped, works and services of industrial production organizations performed, %.
4. Infrastructure factor. The quality and level of infrastructure development determine largely the mobility of business and logistics costs in providing product markets. We will consider only the impact of this factor on the economy of transport infrastructure.
4.1. Transport infrastructure.
4.1.1. Level of railway infrastructure development - density of railway tracks at the end of the year, km of tracks for 10 000 км2;
4.1.2. Level of development of automobile infrastructure - density of public roads with hard surface at the end of the year, km of roads for 1000 km2 of territory;
4.1.3. Quality of automobile infrastructure development - the share of public roads (at the end of the year) with hard surface in the total length of public roads, in percentage/with improved coverage in the length of hard surface roads.
When analyzing the influence of factors on the SES competitiveness in this study, based on the method adopted by international institutions, the weight coefficients of the factors significance are determined:
Taking into account the neoindustrial vector of the “technological breakthrough” development scenario, the greatest share is characterized by the impact on the competitiveness of innovation, technological and macroeconomic factors.
To adapt the developed methods of analysis and assessment of the SES competitiveness in the digital economy, the selection of subjects of the Russian Federation is carried out. In doing so, we were guided by the following principles:
With the use of these principles, a list of subjects of the Federation, the socio-economic indicators of which will be used in assessing the level of their competitiveness and identifying the driver of its improvement, has been formed:
The developed method of assessing the competitiveness of the subjects of the Russian Federation based on factor analysis using a system of indicators characterizing the level of their macroeconomic, social, innovation, technological and infrastructure development allows identifying the main directions of improving the competitiveness of the subject of the Federation.
For the practical implementation of the methodology presented in the study, we have developed a multi-factor mathematical model of SES competitiveness, which allows analyzing objects with a large number of homogeneous features. When choosing the appropriate mathematical apparatus, we were guided by the practical experience of using various methods of multidimensional classification, which showed that the best are the methods of cluster and discriminant analysis (Nivorozhkina, Arzhenovskiy, 2017).
In the processing of statistical data, there is a need to bring their dimension to the comparable form. The principal component method has been chosen to reduce the dimensionality of the data as well as to normalize it. In determining, the most significant competitiveness influence factors was used the analysis method of the sensitivity of indicators to the socio-economic system. For example, an increase in the gross regional product by a percentage contributes more to the development of the socio-economic system than an increase in any indicator in absolute values.
The method of assessing the competitiveness of Russian regions involves bringing the statistical indicators characterizing the impact of various factors on it to a form that allows determining the level of their contribution to the relevant indicators of the Russian economy.
The calculation is carried out in several stages:
1. Collection of initial data of Russian Federal State Statistics Service in accordance with the list of indicators characterizing macroeconomic, social, innovation, technological and infrastructure factors.
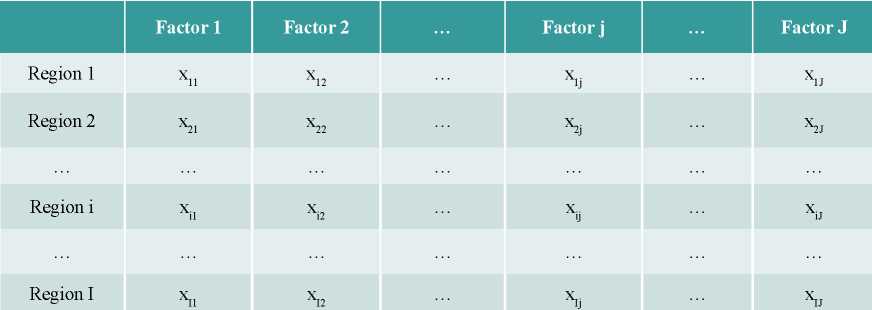
2. The values of the factors, where the rows contain the constituent entities of the Russian Federation (i = 1, 2, ..., I), and the columns contain statistical indicators (j = 1, 2, ..., J), are assigned.
3. Values are calculated for further normalization of the contribution estimates of each factor according to the formulas given below.
The arithmetic mean:

Mean-square deviation (unbiased):

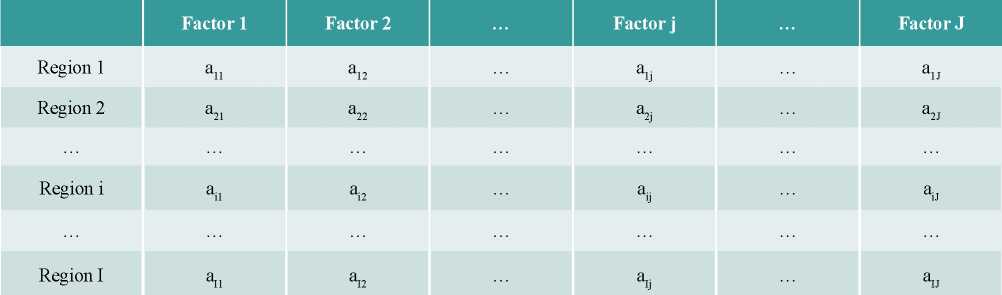
Normalized value of factors by regions:

The verification identical equation must show zero by the sum of the normalized factors (by columns):

At this step, a matrix of factors normalized values is obtained (see table 2.5.).
4. To create a rating and convert negative normalized factors values, they must be transferred to the same level. It is also necessary to convert the negative factors values into a positive scale. The next step is to set the level at which the remaining values for each of the factors are compared. Depending on the significance of the indicator, a minimum or maximum value is assigned. For example, for the indicator of the number of personnel, engaged in research and development, in the average annual number of employed in the economy (%) the maximum value will be taken as a level, because the higher the number of such personnel, the better.
Indicator level:

After determining the level of the indicator, it is necessary to reduce the values for each factor so that the level of the indicator becomes zero, and the remaining values are reduced by the value of the indicator level. Calculation of “distances” of each factor value to the indicator level:

Based on the data obtained, the values for the regions are calculated:

Then the arithmetic mean and mean-square standard deviation (unbiased) for b_i are calculated with the following formulas:
The arithmetic mean:

Mean-square deviation (unbiased):

5. The next step is to calculate the integral indicators of regional competitiveness for each of the indicators blocks.
As the level of dimension (denominator), the sum of the mean and two standard mean-square deviations is taken, since this eliminates the situation when the numerator is greater than one, which is essential for this model. Subtraction of one ranks values in descending order, and substitutes zeros and a significant numbers at the level of uncertainty.

6. The next step is to calculate the integral indicators of the regions competitiveness, due to which the regions are ranked in the future. The integrated index is calculated using the weights of each indicators block:
![]()
7. In the next step, the dependence of the change of the regional competitiveness integral indicator on the change of each of the 32 indicators is calculated and the change of the integral value is estimated.
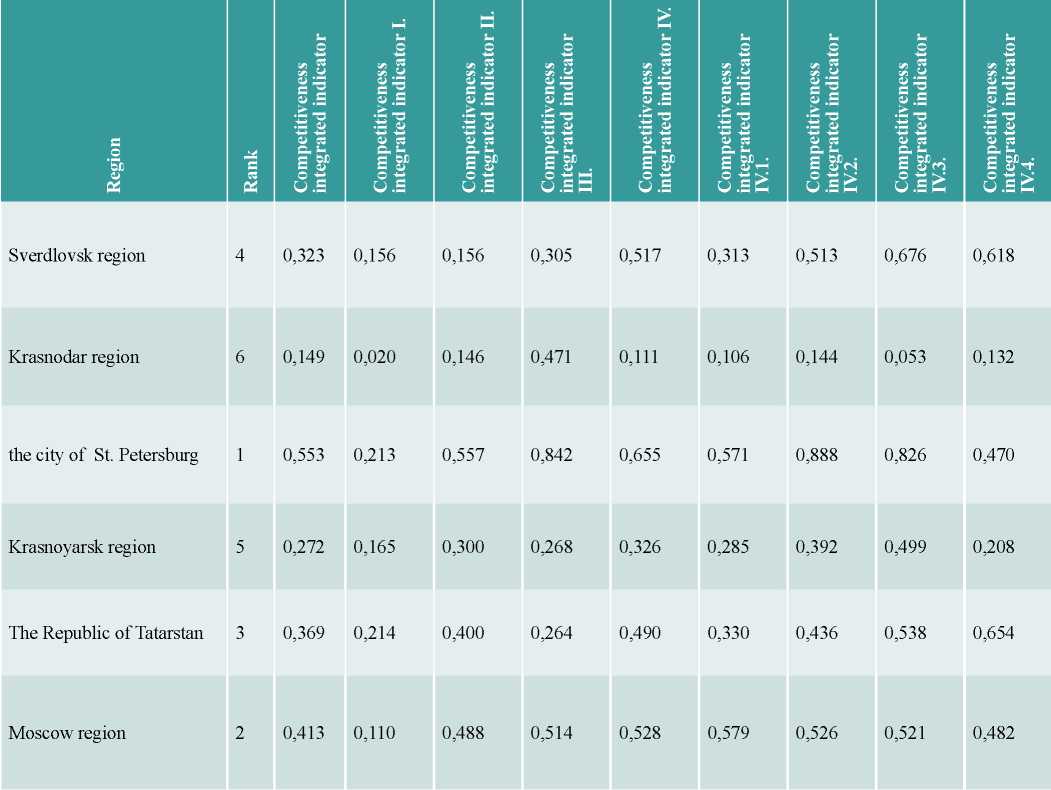
As an example, Table 3 presents an integral indicator of each region competitiveness, as well as partial indicators of competitiveness for each group and subgroup (for group of 4 innovation and technological factors) of indicators in accordance with the statistical data on the economy state of the subjects of the Russian Federation for 20151.
Comparison of the Map of reserves of competitiveness growth and the Matrix of compliance of strategic development documents and indicators of competitiveness of each region allows to determine the use level of existing reserves of competitiveness growth of the region in the concept of its development.
For example, comparing the data of these tables for the Krasnodar region, we find that the region in its development strategy among the indicators of competitiveness growth distinguishes only two indicators present in the Map of reserves of competitiveness growth - “the share of investment in machinery, equipment, vehicles (as a percentage of total investment)” and “the total area of residential premises, falling on average per capita (at the end of the year; square meters).”
In the city of St. Petersburg, the issues of strategic development are worked out more clearly and in detail. Among the indicators reflected in the Map of reserves of competitiveness growth, and in the “Matrix of compliance...”, we find “the share of manufacturing in the GVA”; “the total area of residential premises per capita on average” indicators. To such indicator of the Map as “the share of costs of technological innovations in the total volume of goods shipped, works and services performed” the indicators of the Matrix “the share of organizations engaged in technological innovations in the total number of surveyed organizations of St. Petersburg” and “the share of innovative products in the total volume of products in manufacturing” are close. Unfortunately, such indicators of competitiveness growth, identified in the course of our study, as “training programs”, “organizations that used special software to provide access to databases through global information networks”, “the number of used advanced production technologies per 10 thousand people employed in the economy” are not reflected in the Matrix.
In Sverdlovsk region the strategic development documents cover almost all revealed reserves of growth competitiveness “index of physical volume of investments into fixed capital”; “the total area of residential premises, falling on average per inhabitant”; “public roads (at the end of the year) with hard surface in the total length of public roads”; “the share of expenditures on research and development in % to GRP”; “specific weight of innovative goods, works, services in total volume of shipped goods, performed works and services of the organizations of industrial production.”. Two indicators characterizing degree of industry digitalization - “use of special software for design”; “electronic reference and legal systems” make the exception.
The main results of modeling using the method of assessing the competitiveness of socio-economic systems (for example, six regions of the Russian Federation) based on the selection of four factors, including 32 indicators of competitiveness, showed that the main reserves of competitiveness growth are largely repeated for all regions.
In terms of macroeconomic factor in all regions, the key factors of competitiveness are an increase in the share of investment in machinery, equipment, vehicles (as a percentage of total investment), an increase in the share of manufacturing in gross value added and an increase in the physical volume of investment in fixed assets. Our research has confirmed that insufficient investment in fixed capital, especially in manufacturing, is a major macroeconomic factor in reducing competitiveness.
The analysis of the social factor of competitiveness showed that in all subjects, except for the Moscow region, the main condition for the competitiveness growth is the increase in the indicator “the total area of residential premises per capita (at the end of the year; m2)”. In the Moscow region, this figure is also present for two years of the sample.
The results of the modeling on the infrastructure factor showed that all regions, except the city of St. Petersburg, need desperately improving the indicator “public roads (at the end of the year) with a hard surface in the total length of public roads, in percentage / with improved coverage in the length of hard roads” to improve competitiveness. In the Northern capital, the indicator “density of railway tracks at the end of the year, km of tracks per 10,000 km2 of territory” prevails.
Finally, the analysis of the model results of the innovation and technological factor of competitiveness, represented by the maximum number of indicators, leads to similar conclusions at regions. In the subgroup “innovation and resource potential” the decisive contribution to the total competitiveness belongs to the indicator “the number of personnel engaged in research and development in the average annual number of employed in the economy, %”. There is also a demand for improving the indicators “the share of organizations that carried out technological innovations in the total number of organizations (for industrial production organizations”, “the share of costs for technological innovations in the total volume of shipped goods, works, services” and “the share of research and development costs as a percentage of GRP”.
In the subgroup “business model transformation index” the most popular means of improving competitiveness for all regions are the indicators “organizations that used electronic data exchange between their own and external information systems, according to the formats of exchange”, “organizations that used special software to provide access to databases through global information networks”, “organizations that used special software to solve organizational, managerial and economic problems”. In general, Russian enterprises have achieved great success in the direction of digitalization over the past five years.
In the subgroup “efficiency of innovative technological activity” absolute leaders of competitiveness growth are two indicators - “the number of developed advanced production technologies per 10 thousand people employed in the economy”, “the number of used advanced production technologies per 10 thousand people employed in the economy”.
Finally, in the subgroup “manufacturing digitalization index” the greatest increase in competitiveness is possible due to the improvement of the following indicators: “the use of special software for design”, “the use of special software for the management of automated production.” These indicators most accurately express the essence of the manufacturing industry digitalization, so it is not surprising that they are the main reserve for the competitiveness growth of the entire socio-economic system.
Thus, the developed in this study multivariate mathematical model of analysis and assessment of the competitiveness of socio-economic systems allows us to determine for each subject of the Federation specific factors that most affect the competitiveness of its economy. This makes it possible to determine the direction of resources concentration for the effective socio-economic development of the Federation.
The article is based on the results of research on the state task of the Financial University as of 2018 in terms of research on the topic “Development of a competitiveness model of socio-economic systems in the digital economy.”
2. The choice of analysis as of 2015 is because only this year Russian Federal State Statistics Service presented the entire set of statistical data necessary for the calculation.
1. Aiginger K. (2014). Industrial Policy for a Sustainable Growth Path, WIFO Working Papers 469, WIFO. URL: https://www.oecd.org/eco/Industrial-Policy-for-a-sustainable-growth-path.pdf.
2. Nivorozhkina L.I., Arzhenovskiy S.V. (2017). Multidimensional statistical methods in economics. Moscow, INFRA-M, 203. (In Russ.).
3. Sadovnichy V.A., Akayev A.A., Korotaev A.V., Malkov S.Yu. (2014). Comprehensive modeling and forecasting of the development of the BRICS countries in the context of world dynamics. Moscow, Publishing House "Science", 382. (In Russ.).
4. United Nations Industrial Development Organization, 2013. Industrial Development Report 2013. Sustaining Employment Growth: The Role of Manufacturing and Structural Change. Vienna. URL: https://www.unido.org/sites/default/files/2013-12/UNIDO_IDR_2013_main_report_0.pdf
5. United Nations Industrial Development Organization, 2017. Industrial Development Report 2018. Demand for Manufacturing: Driving Inclusive and Sustainable Industrial Development. Overview. Vienna. URL: https://www.unido.org/sites/default/files/files/2017-11/IDR2018_OVERVIEW_ENGLISH.pdf
6. World Economic Forum, 2017. Global Competitiveness Report 2017-2018. URL: URL: http://www3.weforum.org/docs/GCR2017-2018/05FullReport/TheGlobalCompetitivenessReport2017%E2%80%932018.pdf
Abdikeev N.M., Bogachev Yu.S., Losev A.A., Tolkachev S.A. MULTIVARIATE MODEL OF ANALYSIS AND ASSESSMENT OF THE COMPETITIVENESS OF SOCIO-ECONOMIC SYSTEMS. Strategic decisions and risk management. 2019;10(2):156-165. https://doi.org/10.17747/2618-947X-2019-2-156-165
Ligovsky av 73, of.401, Saint Petersburg, 190040, Russia
Tel.: +7 (812) 346-50-15 (16)
Real Economy Publishing House.
E-mail: info@jsdrm.ru
Registration certificate PI No. FS-77 - 72389 from 02.28.2018, issued by the Federal Service for Supervision in the Sphere of Communications, Information Technologies and Mass Communications.
Processing of personal data


