


Contents
Scroll to:
https://doi.org/10.17747/2618-947X-2019-1-28-35
Scroll to:
Various business process optimization methods associated with industrial companies are reviewed, e.g. the processes of production planning, equipment and inventory maintenance as well as quality control. Case studies of Russian and foreign companies are provided. The author can conclude that digital technologies provide a significant advantage when implemented in an industrial production environment to the demands of Industry 4.0 technologies. The most promising technologies are identified for implementation with a purpose to optimize industrial business processes. According to the findings of the study, implementing econometric methods, creating a cloud infrastructure and adopting digital devices using Internet of things concepts can be named among the most efficient measures for business process optimization in production companies.
Popov N.A. BUSINESS PROCESS OPTIMIZATION IN THE DIGITALIZATION ERA OF PRODUCTION. Strategic decisions and risk management. 2019;10(1):28-35. https://doi.org/10.17747/2618-947X-2019-1-28-35
Much attention was paid to improving the production process in different periods of industrial development. The works of Ford, Crowther (1922), W. Deming (1943), F. Taylor, (1911), G. Gantt (1903) and others laid the theoretical basis of modern methods for improving the efficiency of industrial enterprises. In many companies of the manufacturing sector, “six sigma”, the Total Quality Management system (TQM), and “Just-in-Time” (JIT) are widely used. Today, there is an active interest of the scientific community in the Industry 4.0 phenomenon (Lisowski, 2018; Tarasov, Popov, 2018; Roblek, Mesko, Krapez, 2016). Technologies of the fourth industrial revolution (Industry 4.0) make it possible to carry out optimization measures of production processes at a qualitatively new level using digital technologies.
Table 1
Quantitative methods for product demand prediction (Dean, Xue, Tu, 2009)
|
Indicator |
Coefficients |
Linear regression |
Neural network |
|---|---|---|---|
|
Description |
Coefficients between the resulting indicator and potential factors |
Linear relationships between the resulting indicator and significant factors |
Relationships of any nature between demand factors and the resulting indicator |
|
Advantages |
|||
|
Easy to count |
+ |
+ |
— |
|
Suitability for summary counting |
+ |
— |
— |
|
Detailed result |
— |
— |
+ |
|
Exact result |
— |
+ |
+ |
|
Intuitive conclusions |
— |
+ |
— |
|
Disadvantages |
|||
|
Inaccurate results in detailization |
+ |
|
|
|
The need for more data |
— |
+ |
+ |
|
Lack of accounting for indirect links |
— |
+ |
— |
|
Difficult calculation |
— |
— |
+ |
Consulting company PwC identifies eight core technologies of Industry 4.0: blockchain, unmanned devices, three-dimensional printing, virtual reality, augmented reality, Internet of things, artificial intelligence, robots (Pooh, 2017). They have great potential in improving production processes with integrated and system use. Today, large domestic and foreign companies are actively exploring the possibility of introducing digital technologies to optimize key business processes. Significant results were achieved by PJSC NLMEC, PJSC SIBUR, Siemens AG, Intel and other industry leaders (Lisovsky, 2018). The introduction of digital technology will reduce the cost of individual items up to 30% (Rojko, 2017).
The purpose of this work is to study approaches to optimize production processes using digital technologies. The central object of the study is introduction of digital technologies into the most significant and common production business processes: production planning, equipment maintenance and quality control.
Organization of the production planning process often affects the overall efficiency of the production process, since at this stage of production the load on the equipment is distributed. Irrational capacity utilization can lead to downtime and lower output. An effective planning process involves:
Prediction is usually done using quantitative methods. The most common methods for calculating the potential demand for the products of an industrial company that carries out both standard and non-standard orders are coefficient method, linear regression and neural network (Table I). The choice of prediction method is due to the presence of a streamlined data collection system and the company's ability to analyze the data. Compared to the neural network, linear regression (a simpler method) gives prediction errors of only I percentage point higher. (Dean, Xue, Tu, 2009). At the same time, for implementation and maintenance of the neural network, a team of highly professional programmers, servers for data storing and processing, as well as considerable time resources are required. Regression analysis is less sensitive to technology and funding (Serbul, 2018).
To assess the production capacity, it is necessary to describe how many resources will be required per unit of production, to develop several options for order fulfillment, to distribute the load between the workshops. Taking into account the potential demand, the minimum amount of the required finished product of a typical type to reduce the risk of non-fulfillment of orders can also be estimated.
The most profitable alternative is chosen based on cost factors and speed of order fulfillment. Monitoring the implementation of plans must be made based on a system of key performance indicators. Most often, it is proposed to use performance indicators taking into account terms and planned resource support (man-hours, equipment and materials use time) (Chae, 2009). Subsequently, the monitoring system can be automated by introducing a CRM system. When planning production cycles, risks must be laid down: possible order cancellation, execution of a more urgent order. Adjustments should be made systematically, based on an analysis of the achievement of previous plans and additional individual information about current orders.
Equipment wear leads to an increase in operating costs for its maintenance, increasing the risk of lower quality. To minimize the negative effects of equipment wear, many companies implement various strategies for maintenance and service. (Ding, Kamaruddin, 2015). Preventive maintenance involves systemic inspections and predictive analytical measures to prevent cases of malfunction. Corrective maintenance is a measure of equipment repair after it is out of order.
For maintenance and repair (MRO) of equipment, three basic concepts are highlighted: Total Productive Maintenance, Reliability Centered Maintenance and Business Centered Maintenance (Tinga, 2013). Fromthe standpoint of automation, the concept of service based on reliability is of the greatest interest, since equipment, in particular its technical condition, is its central element.
With service based on reliability, the emphasis falls on preventive measures. The methodology of this concept allows you to answer three questions:
The concept can be implemented through the following steps:
Industry 4.0 contains a wide range of technologies that allow companies to use the opportunities of digitalization in the field of maintenance and repair. Thus, at the Novolipetsk Metallurgical Combine, replacement of tuyeres of Rossiyanka blast furnace is carried out in accordance with the burning model of this piece of equipment built using machine learning. The model was based on studying current practices, collecting an array of historical data obtained with the use of sensors and laboratory tests. Prediction of equipment failure and timely tuyeres replacement are carried out. The effect of tuyeres replacement in accordance with the recommendations of the model is estimated at 120 million rubles, per year (Arshavsky, 2018). In each PJSC SIBUR, NFC tags were installed on each unit using Near Field Communication technology (NFC). Using the tablet, an employee can read all the necessary information on the maintenance and repair of a single piece of equipment from an NFC tag. After completing the maintenance, all necessary data on the work performed is recorded (Tarasov, Popov, 2018).
Fig. 1. Fourlevels of quality management in production (O’Regan.Prickett, Setchietal., 2017)

In the scientific literature, there is a large number of works devoted to the study of the causes of defects in the workplace. Review of scientific papers presented in the work of Harding allows you to create a complete picture of the key factors affecting the decline in the quality ofproducts (Harding, Shahbaz, Srinivasetal., 2006). A lack of understanding of the common causes of defects causes the organization to incur significant financial and reputational losses (Chongwatpol, 2015). However, in a particular company, common factors become private. To recognize defects, their causes, to classify and apply appropriate adjustment measures, a quality control system for production processes can be arranged. In accordance with the practice of Renishaw consulting company, this system can be represented as a four-level pyramid: quality control is divided into informational (finished products), active (production process), predictive (equipment and materials) and preventive (external factors) (O'Regan, Prickett, Setchi et al., 2017) (Fig. 1).
Table 2
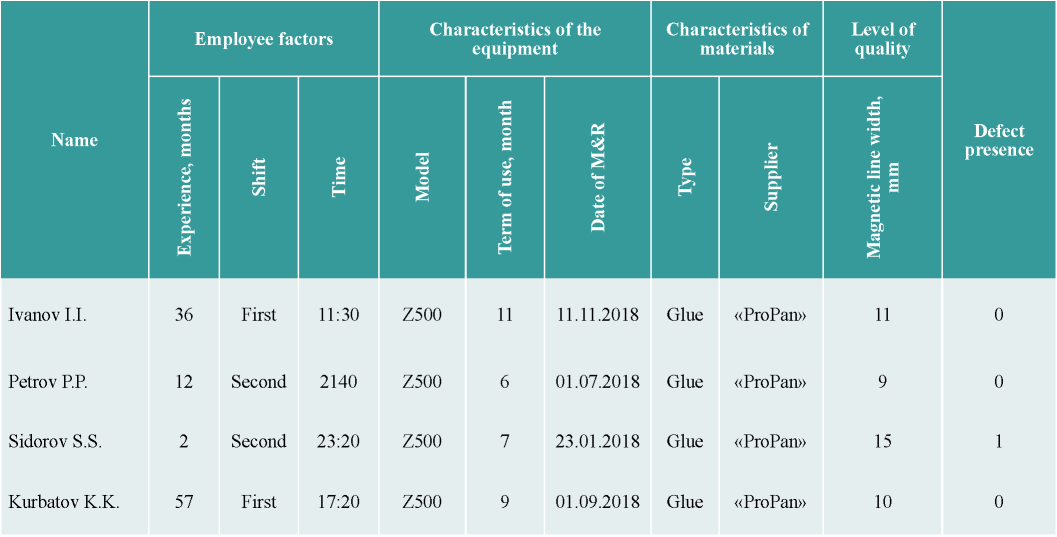
An example of a control registry of defects (Chongwatpol, 2015)
Preventive control. The basis of control is provided by the monitoring system of the monitored parameter and the automated adjustment of its value to the required value in real time. With the help of digital sensors and the Internet of Things, you can fine-tune the process and optimal adjustment. For example, in industrial premises, great attention is paid to the environment, primarily humidity and air temperature.
Temperature control is provided by a switch system, proportional and integral systems (Temperature controller basics, [s.a.]). For a switch system, an optimal temperature value, which must be maintained indoors, is set. In case of deviation from this value, the system automatically begins to heat / cool the air until the optimum point is reached. When introducing a switch system, as a rule, the temperature range is set so that the heating system does not start up with minimal deviations. Such solutions are the simplest and relatively cheap.
Proportional temperature control systems operate on a more complex algorithm: the optimal points can be built depending on time. This is relevant in production, where different conditions need to be maintained at different stages.
Integrated systems not only take into account the environmental conditions, but are also able to change the optimal temperature points depending on the volume of production. This allows you to quickly respond to dramatic changes in the specificity of the production process.
Predictive control. As part of the transition to Industry 4.0, the development of measures to minimize the level of defects in production is of particular importance. Among the factors that may cause product defects, scientific work referred to the serviceability of equipment, the quality of input materials, duration of the work shift (as a factor in workers' fatigue) and workers' experience (Leachman, Pegels, Kyoon Shin, 2005). It is noted that for the analysis of causal relationships between defects in production and potential factors, econometric methods are used most often: decision tree, regression models, neural networks and cluster analysis (Hazen, Boone, Ezell et al., 2014).
To reduce the share of defective products in production, an analytical system for monitoring defects can be organized.
When building it, as a rule, an interdisciplinary standard process for data exploration is used (Cross-Industry Standard Process for Data Mining, CRISP-DM). CRISP-DM methodology involves six stages of implementation:
For complex reduction of the level of marriage, it is important to diagnose defects. Three approaches are proposed for this process: a control register, cost stratification and cluster analysis (Chongwatpol, 2015).
Control register assumes registration of detected defects by means of a binary code (I - a defect is detected, 0 - no defect). The presence of a defect is determined by exceeding the normative values according to specified quality criteria. The table also prescribed:
An example of a control register for recording defects in production is presented in Table 2. The control register is simple, convenient and practical to use as it allows not only to monitor defects, but also to analyze factors. It allows you to identify the factors that cause deviations from the lower and upper limits of the range of the quality parameter. For clarity, a graphical method can be used: a graphical depiction of points of deviation from the allowable range increases the level of intuitive interpretation of data from the control register. Thus, it is most appropriate to use tabular and graphical ways of displaying information to identify defects.
Expense stratification analyzes product defects in terms of financial implications. If the batch of products turned out to be defective, then the company incurs additional expenses on materials, payment for the work of employees, payment of penalties to the customer, etc. Expense stratification involves calculation of special indicators:
These metrics allow you to qualify groups of goods depending on the cost due to defects.
Different approaches can be used to classify types of products according to the cost of defects: ABC analysis method (Kampf, Lorincova, Flitka et al., 2016), methods based on the decision tree (Kim, Oh, Jung et al., 2018), step-by- step regression to build a predictive model of potential costs for defective products during the planning period (Kvasova, Tselykh, 2012). The meaning of cost stratification is that quality controllers and senior staff of the shift can first of all pay attention to the types of products where a defect has the greatest financial consequences.
Cluster analysis provides a multi-dimensional analysis of production processes. Some types of finished products may have similar characteristics: materials and equipment, the required number of man-hours, the necessary temperature conditions, etc. Cluster analysis allows you to form product groups that are close in terms of production processes. The к-means method is the simplest and most popular clustering method. Within each group, the percentage of potential spoilage can vary, and therefore the approaches to quality control of production processes may differ for different clusters (Chongwatpol, 2015).
Within the framework of the predictive control, a quick prototyping deserves special mention. This method allows to significantly reduce the time and resources for preparing layouts (Rayna, 2016). Rapid prototyping combines a group of technologies and technological processes that use three- dimensional printing based on computer simulation. The most common following rapid prototyping technologies are:
In the context of quality control and defect prevention, we have an example. Lin Engineering (2017) specializes in the production of hybrid engines. The main production is based in China, the head office and distribution center are in the United States. In case of delivery of defective products, the company incurred significant costs for sending the defected products back to the factory. Implementation of a statistical process control system using cloud technologies allowed real-time monitoring of production at a Chinese plant from US headquarters. In case of defects, the system automatically generates an e-mail with a description of the problem well before sending the batch.
Active control. Work on the elimination of identified defects is carried out in the framework of the production process. Industrial cameras can be used to control the quality of the cut lines. The camera can have thermal sensors that allow you to measure the temperature of stocks and finished products at any stage of production processes. Defects that are invisible to the human eye are identified by technical means, the process is automated. Consequently, the factor of human inattention or fatigue can be completely excluded. In case of detection of defects, the camera can transmit a signal to the central warning system, thereby preventing the occurrence of the identified defect in the entire batch. One of the suppliers of such technical solutions is Allied Vision. There are also cameras with integrated color sensors that can monitor the quality of the applied paint. Similar solutions are supplied by Ornron.
Informative control is aimed at the quality of manufactured products. The main task is to describe and implement the process of monitoring the shipped products and dealing with customer complaints. Digital technologies provide ample opportunities for building an appropriate information system. So, all information about claims from consumers can be stored in the cloud storage. This will simplify the monitoring of databases and facilitate access to information for various departments. Electronic document management system allows you to structure the available information in the organization and to quickly exchange files, for example by means of NFC tags.
Digital technologies will facilitate the work of expert commissions to eliminate defects in enterprises. Expert meetings can be held remotely via electronic communications. An expert- representative of a department makes recommendations in his area of responsibility. For each unit, a time limit on the formation of recommendations should be set. After receiving recommendations from all members of the commission, the production department should take appropriate measures to eliminate the defects and form a report. This report can be attached to general information on working with a specific claim.
In the transition to the Paradigm of Industry 4.0, previously developed methods for optimizing production business processes remain relevant. The use of digitalization technologies will allow the use of such optimization methods that were previously unavailable due to the lack of the necessary infrastructure. The company is responsible for choosing specific methods and technologies used, since it may have its own strategic priorities and resource constraints. Only an optimal combination of implemented measures and their compliance with existing and future needs will allow companies to make cost-effective and efficient business optimization.
1. Arshavskij, A. (2018). Iskusstvennyj intellekt v metallurgii // NLMK [Arshavsky, A. (2018). AI in metallurgy. NLMK. (In Russ.).]. URL: http://www.cloudmobility.ru / sites / default / files / 13.25–13.45_arhavsky_nlmk_new.pdf.
2. Kvasova, N. A. Celykh, V. N. (2012). Metodika ocenki ekonomicheskikh poter po vidam defektov na osnove sistemy kriteriev KR-benchmarkinga // Sovremennye problemy transportnogo kompleksa Rossii. 2:295–298. [Kvasova, N. A., Zelykh, V. N. (2012) Methods of estimating economic losses by types of defects based on the system of criteria for CI-benchmarking. Modern Problems of Russian Transport Complex. 2:295–298. (In Russ.).].
3. Lisovskij, A. L. (2018). Optimizaciya biznes-processov dlya perekhoda k ustojchivomu razvitiyu v usloviyakh chetvertoj promyshlennoj revolyucii // Strategicheskie resheniya i risk-menedzhment. 4:10–19. [Lisovsky, A. L. (2018). Optimization business processes for transition to a sustainable development in the conditions of the fourth industrial revolution. Strategic Decisions and Risk Management. 4:10–19. (In Russ.).]. DOI: https://doi.org / 10.17747 / 2078 8886 2018 4 10 19.
4. Pukha, Yu. (2017). Industrial'naya revolyuciya 4.0 // PricewaterhouseCoopers. [Pukha, Yu. (2017). Industrial revolution 4.0. PricewaterhouseCoopers. (In Russ.).]. URL: https://www.pwc.ru / ru / assets / pdf / industry-4–0 pwc.pdf.
5. Serbul, A. (2018). Nejronki: kakomu biznesu nuzhen iskusstvennyj intellekt i lajfkhaki kak ego vnedrit // Delovoj zhurnal «Inc.». [Serbul, А. (2018). Neurons: what business needs AI (and life hackings, how to implement it). Business magazine «Inc.». (In Russ.).]. https://incrussia.ru / understand / nejronki-kakomu-biznesu-nuzhen-iskusstvennyj-intellekt-i-lajfhaki-kak-ego-vnedrit / .
6. Tarasov, I. V. Popov, N. A. (2018). Industriya 4.0: Transformaciya proizvodstvennykh fabrik // Strategicheskie resheniya i risk-menedzhment. 3:38–53. [Tarasov, I. V., Popov, N. A. (2018). Industry 4.0: Production factories transformation. Strategic Decisions and Risk Management. 3:38–53. (In Russ.).]. DOI: https://doi.org / 10.17747 / 2078 8886 2018 3 38 53.
7. Chae, B. (2009). Developing key performance indicators for supply chain: an industry perspective. Supply Chain Management: An International Journal. 14 (6):422–428. DOI: 10.1108 / 13598540910995192.
8. Chongwatpol, J. (2015). Prognostic analysis of defects in manufacturing. Industrial Management & Data Systems.115 (1): 64–87. DOI: https://doi.org / 10.1108 / IMDS-05 2014 0158.
9. Dean, P. R., Xue, D., Tu, Y. L. (2009). Prediction of manufacturing resource requirements from customer demands in mass-customisation production. International Journal of Production Research. 47 (5):1245–1268. DOI: https://doi.org / 10.1080 / 00207540701557197.
10. Deming, W. (1943). Edwards. Statistical Adjustment of Data. Dover. 261 p.
11. Ding, S. H., Kamaruddin, S. (2015). Maintenance policy optimization – literature review and directions. The International Journal of Advanced Manufacturing Technology. 76 (5–8):1263–1283. DOI: 10.1007 / s00170 014 6341 2.
12. Ford, H., Crowther, S. (1922). My Life and Work. Garden City, New York: Garden City Publishing Company, Inc. 231 p.
13. Gantt, H. L. (1903). A graphical daily balance in manufacture // Transactions of the American Society of Mechanical Engineers. Vol. 24. P. 1322–1336.
14. Hague, R., Mansour, S., Saleh, N. (2004). Material and design considerations for rapid manufacturing. International Journal of Production Research. 42 (22):4691–4708. DOI: 10.1080 / 00207840410001733940.
15. Harding, J. A., Shahbaz, M., Srinivas et al. (2006). Data mining in manufacturing: a review. Journal of Manufacturing Science and Engineering. 128 (4):969–976. DOI: 10.1115 / 1.2194554.
16. Hazen, B. T., Boone, C. A., Ezell, J. D. et al. (2014). Data quality for data science, predictive analytics, and big data in supply chain management: An introduction to the problem and suggestions for research and applications. International Journal of Production Economics. 154:72–80. DOI: 10.1016 / j.ijpe.2014.04.018.
17. Kampf, R., Lorincova, S., Hitka, M. et al. (2016). The application of ABC analysis to inventories in the automatic industry utilizing the cost saving effect. NASE MORE: znanstveno-strucnicasopisza more ipomorstvo. 63 (3. Spec. Issue):120–125. DOI: 10.17818 / NM / 2016 / SI8.
18. Kim, A., Oh, K., Jung, J. Y.et al. (2018). Imbalanced classification of manufacturing quality conditions using cost-sensitive decision tree ensembles. International Journal of Computer Integrated Manufacturing. 31(8):701–717. DOI: https://doi.org / 10.1080 / 0951192X.2017.1407447.
19. Leachman C., Pegels, C., Kyoon Shin, S. (2005). Manufacturing performance: evaluation and determinants. International Journal of Operations & Production Management. 25 (9):851–874. DOI: https://doi.org / 10.1108 / 01443570510613938.
20. Lin Engineering uses cloud-based quality control to monitor overseas facility ([s.a.]). InfinityQS. https://www.infinityqs.com / resources / case-studies / lin-engineering.
21. O’Regan P., Prickett P., Setchi R.et al. (2017). Engineering a More Sustainable Manufacturing Process for Metal Additive Layer Manufacturing Using a Productive Process Pyramid. In: International Conference on Sustainable Design and Manufacturing. Cham: Springer. 736–745. DOI: 10.1007 / 978 3 319 57078 5_69.
22. Production Planning in 5 Steps ([s.a.]). Smetoolkit. https://smetoolkit.ng / articles / 17production-planning-in-5 steps.
23. Rayna, T., Striukova, L. (2016). From rapid prototyping to home fabrication: How 3D printing is changing business model innovation. Technological Forecasting and Social Change. 102:214–224. DOI: https://doi.org / 10.1016 / j.techfore.2015.07.023.
24. Roblek, V., Mesko, M., Krapez, A. (2016). A Complex View of Industry 4.0. SAGE Open. https://doi.org / 10.1177 / 2158244016653987.
25. Rojko, A. (2017). Industry 4.0 concept: background and overview. International Journal of Interactive Mobile Technologies (iJIM). 11 (5):77–90. DOI: 10.3991 / ijim.v11i5.7072.
26. Stable Humidity Optimises Digital Print Operation ([s.a.]). Humidity Solutions Ltd. http://www.humidity-solutions.co.uk / case_studies / HS%20VGL%20case%20study.pdf.
27. Taylor, F. W. (1911). The Principles of Scientific Management. New York; London: Harper & brothers. 144 p.
28. Temperature controller basics ([s.a.]). Learning instrumentation and control engineering. https://www.instrumentationtoolbox.com / 2016 / 09 / temperature-controller-basics.html.
29. Tinga, T. (2013). Maintenance concepts. In:Principles of loads and failure mechanisms, ed. H. Pham. London: Springer. 161–186.
30. Vishnu, C. R., Regikumar, V. (2016). Reliability based maintenance strategy selection in process plants: a case study. Procedia Technology. 25:1080–1087. DOI: https://doi.org / 10.1016 / j.protcy.2016.08.211.
Research associate, Center for industry research and consulting of the Financial University under the Government of Russian Federation.Research interests: IT-technologies in the operational efficiency of business, digitalization of production, crisis and arbitration management.
Popov N.A. BUSINESS PROCESS OPTIMIZATION IN THE DIGITALIZATION ERA OF PRODUCTION. Strategic decisions and risk management. 2019;10(1):28-35. https://doi.org/10.17747/2618-947X-2019-1-28-35
Ligovsky av 73, of.401, Saint Petersburg, 190040, Russia
Tel.: +7 (812) 346-50-15 (16)
Real Economy Publishing House.
E-mail: info@jsdrm.ru
Registration certificate PI No. FS-77 - 72389 from 02.28.2018, issued by the Federal Service for Supervision in the Sphere of Communications, Information Technologies and Mass Communications.
Processing of personal data


