


Contents
Scroll to:
https://doi.org/10.17747/2078-8886-2018-1-64-71
Scroll to:
The aim of the research is to develop the methodology of bankruptcy prediction applying the specified statutory values of the existing models with a glance to company’s industry and developing the author’s prediction model. Initially authors estimated the forecast accuracy of the existing models for the enterprises of 8 industries. Using CART (Classification And Regression Tree) methodology the original statutory values of the models were specified for every industry under research. The calculated statutory values demonstrated the high level of prediction accuracy and balanced the indicators of accuracy for bankrupt and non-bankrupt companies. The indicators with the maximum level of significance for bankruptcy prediction were selected from all the models. They formed a basis for a new developed model, which has demonstrated the high level of prediction accuracy on a sample under research. The statutory values for the new model were also developed.The implementation of the research’s results will increase the efficiency of bankruptcy prediction and low the number of bankrupt companies.
Fedorova E.A., Khrustova L.E., Chekrizov D.V. Industry characteristic of bankruptcy prediction models appliance. Strategic decisions and risk management. 2018;(1):64-71. https://doi.org/10.17747/2078-8886-2018-1-64-71
Trelevance of bankruptcy forecasting of economic entities resulted in large numbers of case studies. Among the main challenges of examining the issue we can single out the development of effective tools for evaluating the financial condition of the company, therefore many different models to determine the probability of bankruptcy have been developed.
Existing forecasting models represent some combination of the financial performance of the company that reasonably determines the probability of loss of financial stability, based on existing conditions. The accuracy of the forecast of a certain model impacts the timeliness of decision-making, directed to prevent financial insolvency.
Domestic and foreign authors propose a number of models that show fairly accurate results of forecasting and acquired the status of a classic. These include two-factor and five-factor model of E. Altman, models of D. Fulmer, model of R. J. Taffler and H. Tisshaw, G. Springate, R. S. and G. Saifullin and G. Kadykova, O. P. Zaitseva, etc. Classical models of bankruptcy forecasting were tested for many organizations and has demonstrated their accuracy and reliability, but testing on diverse samples have shown that the prediction results significantly differ depending on the size of the firm, its industry affiliation, legal organizational form, degree of state regulation, the government's presence among the shareholders and its share. The identified issue has been addressed with the new models, which turned out to be a lot of [LieuP. T., Lmc. w., YuH. F., 2008; NamJ.H., JmnT., 2000; BandyopadhyayA., 2006].
At the root of most bankruptcy forecasting models lies financial indicators (ratios) that characterize different aspects of the organization activity. Modem authors analyze a selection of the most representative indicators and the establishment of the correct standards of their evaluation.
Many foreign researchers have tried to compare the accuracy of predicting bankruptcy using accounting indicators and market data, to identify models and financial performance indicators that demonstrate the most accurate result [Li M.Y., Miu P., 2010; BauerJ., Agarwaal V., 2014; Tian S., Yu Y., Guo H., 2015;
L. chiaramonte, B. casu, 2017; F. Lin et al.,2014]. Amajor contribution to the development of this issue has been made by T. Korol, who systematized and explored 26 bankruptcy forecasting models using a sample of enterprises in Central Europe and Latin America. The models were divided into statistical models (logit and probit approaches, discriminant analysis models) and models based on "soft" computing (building artificial neural networks, genetic algorithm) [Korol T., 2013].
None of the considered models can't be called universal. Scientists seek to develop the most optimal model for bankruptcy predicting, but the large number of internal and external factors that determine the specifics of each company activity, does not allow to develop the perfect formula which can equally accurately predict the probability of bankruptcy for all organizations. That is why modem researches in the field of bankruptcy directed to the specification of the existing models, based on private characteristics of the companies under review, with the aim to improve the effectiveness of forecasting. In particular, the interpretation of assessment results of the financial condition of the organization is influenced by its industry affiliation.
In our study we made an attempt to improve the existing classical and modem models of bankruptcy forecasting by clarifying the values of the calculated indicators based on specificity of the industry of companies proposed by the authors.
First of all, 10 models of bankruptcy forecasting, both classic and modem, had been selected.
The performance of each model was tested at a sample of 5318 enterprises, which are divided into sub-groups by industry sector: manufacturing, agriculture, real estate, constmction, hotels and catering, transport, science and trade. As a result, performance assessment boundaries calculated in the process of application of models, they were specified taking into account the industry specifics of the company.
The empirical basis of the study included the data of registers of accounting with the allocation of the company by industry:
We assumed that the belonging of the company to a certain industry has a significant impact on its activities. A similar idea had been repeatedly considered in the works of foreign and domestic authors [Sayari N.,c. S. Mugan, 2017; Ilysheva N. N., Kim N. V., 2007; Fedorova E. A., Dovzhenko S.E., F. Fedorov, F.Y., 2016]. When calculating most of the models use various financial ratios, normative values of which are recommended to be evaluated based on the average values of these indicators, logically to assume that the values calculated in the bankruptcy prediction models, should consider sectoral specificities of companies.
Of the huge number of models used to predict bankruptcy, we selected the most popular, variables of which best fit to fonned sample of enterprises (table I). Considered classical models such as the modified five-factor model of E. Altman, four-factor predictive model of R. J. Taffler and H. Tisshaw, G. Springate, four-factor model of R. Lis, model of R. S. Saifulina and G. Kadykova, have been repeatedly described and characterized in the economic literature. Their effectiveness has been tested and proven on a large sample of companies, so consideration of these models is still in the spotlight.
In conditions of significant growth of financial information volume and the diversity of challenges in forecasting the bankruptcy, the classical models are still widely used in practice, but their prognostic capability is not always high. Special attention should be paid to less studied models. Models of [GalvaoR. K. H., Becerra V. M., Abou-SeadaM., 2004; Sorins R., Voronova I., 1998; ZmijewskiM. E., 1984; Brmdescu-OlariuD., 2017] selected by the principle of compliance of the financial coefficients with the parameters available in considered sample and the relative simplicity of calculation. However, we can still name many of similar models that have also demonstrated their effectiveness for certain companies. Let us consider the selected models in greater detail.
M. E. Zmijewski analyzed 17 models of bankruptcy forecasting, having assessed how the sample companies for testing the developed models has been fonned. The limited empirical base used to test the model, does not allows us to speak about its universal applicability. Sam M. E. Zmijevski suggested a model on the basis of three financial ratios (returns on assets, the ratio of total liabilities to total assets, current liquidity ratio), by assuming that if the calculated index is greater than 0, the reporting company must be attributed to the number of bankrupts.
R. Sorins, I. Voronova united in their model the rate of return on assets by EBIT, turnover of total assets, the ratio of net working capital to total assets, the ratio of retained earnings to total assets, the ratio of book value of equity to total liabilities. Three of listed ratios focus on a comparison of individual characteristics of the company's activities with the value of its total assets, thus, the basis of assessment of financial stability is the assets of the economic subject. If calculated in accordance with this model index is less than 0 then the company should be attributed to the number of bankrupts.
Model of D. D. Brmdescu-Olariu developed in conditions of the rapid increase in the number of insolvent companies in Romania. Under the influence of the economic crisis and accession to the European Union there is an urgent need to find a convenient and accessible tool that will allow us to assess the financial condition of a company. As a result, a logistic regression model that takes into account five ratios was built. As noted by the author, this model does not give an absolute prediction accuracy, however, ensures the correct grouping of companies with respect to their financial stability. The model was tested on a sample consisting of 53 thousand companies.
R. Κ. H. Galvao, V. M. Becerra, M. Abou-Seada was looking for the most accurate and effective coefficients for the purpose of forecasting of bankruptcy. After analyzing the existing models and technology of financial indicators selection to build them, the authors identified the advantages and disadvantages of different coefficients, built a model of bankruptcy forecasting using prior and genetic (artificial) selection. The final model synthesizes ratios of total assets turnover, ratio of the net working capital to total assets, the ratio of retained earnings to total assets, ratio of book value of equity to total liabilities. Thus, for this model, in part, the same criteria have been selected, as for the model of
R. Sorins, I. Voronova. Model of R. K. H. Galvao, V. M. Becerra, M. Abou-Seada was tested on 70 companies in the UK and showed the result with an accuracy of 74%.
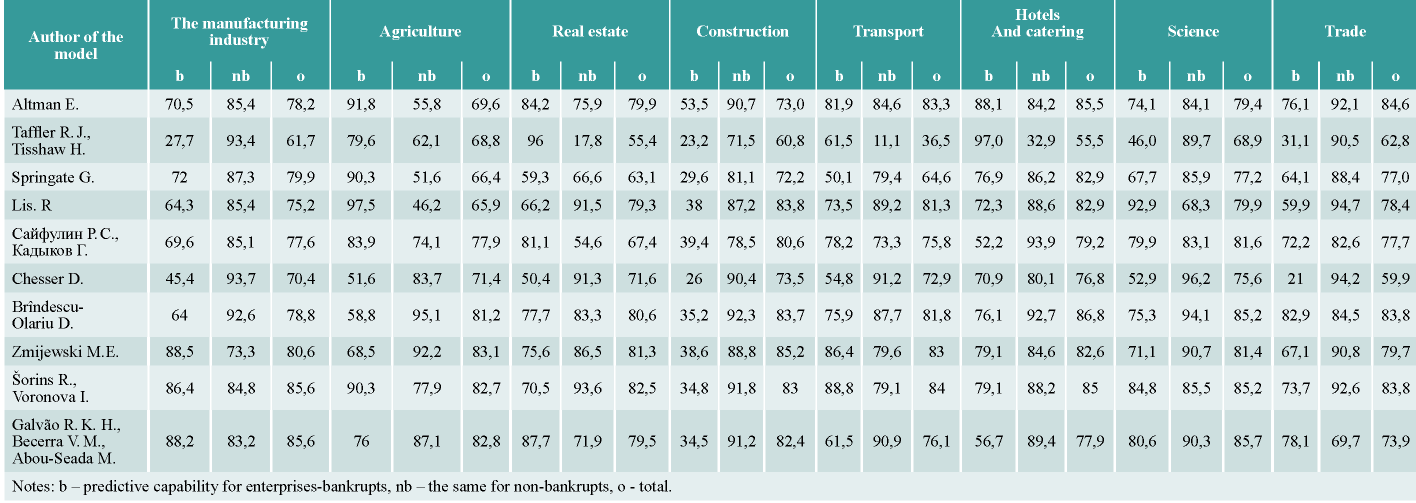
The analysis of predictive ability of models for enterprises of different industries have shown that the same standard normative values can show different degree of accuracy since companies, engaged in various activities, have many specific features. There are several models that demonstrate high prediction accuracy for companies of any sector (e.g., model of R. Κ. H. Galvao,)
V. M. Becerra, M. Abou-Seada, D. Brindescu-Olariu) (table 2). At the same time, it is impossible to call some models consistently effective (e.g., model of R. J. Taffler, H. Tisshaw), because for some industries the prediction accuracy barely more than 50%.
Enterprises of some sectors (e.g. real estate) are generally difficult to predict the insolvency: the indicators of predictive capability are often low regardless of the model applied.
It is also necessary to pay attention to the obtained values of the predictive capability of models for bankrupt nonbankrupt companies compared to total predictive capability. The effectiveness of the model application usually estimated by a general indicator of predictive capability. Sometimes, however, a high indicator of the overall predictive capability can be obtained exclusively by accurate prediction of one of the components (bankrupts or non-bankrupts). The most striking example is the application of a modified five-factor model of E. I. Altman for enterprises in the field of science. The overall predictive ability of the model reached 47.6%. The model predicts the bankruptcy of the company with 100% accuracy, and conducts calculation for non-bankrupt enterprises with an accuracy of 0%. In the calculation for the given sample of organizations in the field of science the existing standard refers them to the category of insolvent organizations. Due to the 100% convergence of calculations for bankrupt companies overall predictive ability of the model shows average values.
In order to improve the prediction of bankruptcy for companies in various industries, we have specified standard values of the considered models: selected individual borders of estimation for each industry. Normative values calculated with application of classification methodology And Regression Tree (cART), which by means of building a binary decision tree allowed us to divide the set of financial indicators of the company (in this case these are the final coefficients resulting from the application of bankruptcy forecasting models) into two parts according to some threshold, which allows to assess the financial condition of the company. Thus, the cART methodology find out the optimal calculated value of the model through which companies can be divided into a financially stable and susceptible to bankruptcy. This methodology was also used in [Elung c., chen J. H., 2009; KorolT., 2013]. '
To review selected models, information about companies was taken in information systems "SPARK" and "Ruslana", data of Rosstat and the Central
Bank of the Russian Federation were used.
The results of the updated values of the estimated coef ficients calculated by the models presented in table 3. For each model the original value of the indicator, recommended by the author to distinguish the bankrupt companies, the values of the indicators for enterprises, calculated using the cART methodology. The table shows that it is impossible to identify a single tendency of values change in calculated indicators in comparison with the original ones. In fact, interpretation of values is necessary for each individual model based on industry affiliation of companies.
AU calculated values of indicators for all sectors and models are distinctly different from the original values proposed by the authors. Often the results for separate industries are different. This suggests that industry affiliation of the company has a significant impact on its financial performance, and hence on the probability of bankruptcy, calculated through the listed models For manufacturing industries only the four-factor model demonstrated a slight deviation of calculated indicator from the original one. Flowever, for other industries the model changes its threshold valuation. It can be said that the indicators used to determine bankruptcy in this model, have a lower specificity in the manufacturing industry. In the case of model D. chesser obtained values are slightly different in different industries. Consequently, the financial performance of mentioned models is close, despite industry affiliation.
Some models, like the model of S. R. Saifulin and G. Kadykov for agriculture, transport and hotel business, model of E. Altman for transport, give the values, which change their sign from positive to negative, i.e., in some cases companies can operate successfully even with negative value of the evaluation indicator. A similar situation is observed in the application of the model of R. Sorins, I. Voronova. Initially, all companies with a value of the calculated index below 0 were allocated to bankrupts. The values lower the border in the negative plane, and thus the companies are able to continue effective operation even with the negative value of required indicators To confirm the significance of the found values of the coefficients and their validation we calculated the number of organizations that may be bankrupt in accordance with these indicators. Further, the forecast was compared with a real financial condition, indicated by I if the company is bankrupt and 0 if the organization is financially stable. The results are presented in table 4, where percentage shows the degree of forecast accuracy, carried out with the use of calculated values. Data show the high prediction accuracy of the proposed values for the evaluation of models. A detailed comparison of predictive capability of the original standard values of considered models and calculated industry values suggests the increase in the total predictive capability of all models for selected industries. However, in some cases, the total predictive ability of calculated normative values has decreased. A similar situation exists for those models where there is a high discrepancy between predictive bility for bankrupt companies and financially sustainable organizations. Thus, the new standard value designed to reduce the disproportion between the degree of prediction accuracy for the insolvent and financially stable companies, which will allow us to speak about higher efficiency of bankruptcy forecasting.
Table 1
The models of bankruptcy prediction, used for verification, and their contents
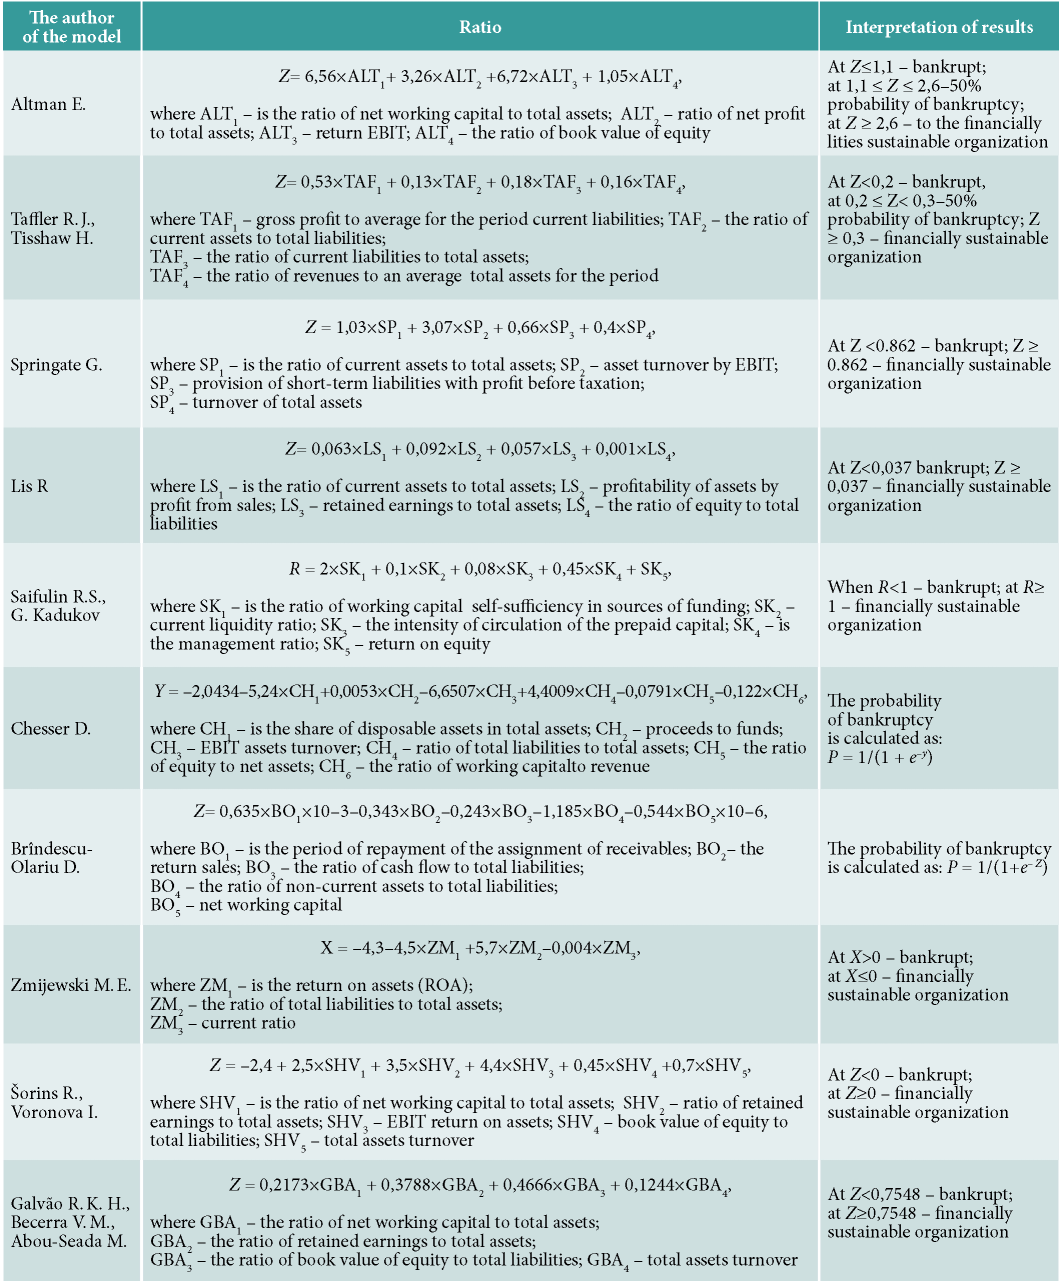
Table 2
Predictive capability of the original standard values for companies, %

Average predictive capability of the proposed indicators is approximately equal to 77%, in many sectors and models it is higher than 80%. The minimum accuracy of the forecast model demonstrates the model of R. J. Taffl , H. Tisshaw for the transport sector; the maximum accuracy was noted in the model of D. Brindescu - Olariu for companies of the "hotels and catering" sector.
The analysis allowed us to suggest that distinguishing the most important financial indicators that compose the basis for the popular models of bankruptcy forecasting, their comprehensive processing and testing on a sample will allow to build a new model that demonstrate high validity of the results. A method of building a standard logistic regression model made it possible to develop the model presented below. Selecting indicators for this model, we were not limited to sample presented in table I. We considered other coefficients used in the models not covered in this study.

where β — is the index value estimated for bankruptcy forecasting in accordance with the developed criteria; X1 - current assets to total assets (model of G. Springate); X2 - the difference of total liabilities and total assets.: 1 - total liabilities exceed total assets, 0 - total assets exceed total liabilities (model of J. Ohlson); x3 - endowment of accumulated obligations with revenue (model of J. Ohlson); X4 - product profitability (model of R. S. Sai fulina and G. Kadyкоva); X5 - the natural logarithm of tangible assets (model of D. Fulmer); X6 - natural loga-rithm EBIT interest to pay (model of D. Fulmer).
The generated model was tested on a sample of enterprises. For each industry a specific normative value was obtained for the evaluation of the developed model. Obtained normative values, indicating potential bankruptcy of the organization, and the degree of prediction accuracy are presented in table 5.
Analysis of the obtained values of the predictive capability of the model by industry reveals a high efficiently of its application. Overall accuracy of the forecasting is 80.2% minimum, and for most industries it exceeds 82%. For bankrupt companies and financially sustainable organizations the predictive capability of the model ranges by sectors from 78 to 89%, which also confirms its high degree of reliability. Minimal accuracy of prediction observed in respect of the bankrupt companies in the agriculture sectors, maximum - for the bankrupt companies operating in the field of transportation.
Table 3
Updated values of the indicators calculated on the basis of bankruptcy forecasting models
|
The author of the model |
The original indicator |
Manu facturing industry |
Agriculture |
real estate |
Construction |
Transport |
Hotels and catering |
science |
Trade |
|
Altman E |
≤1,1 |
≤1,81142 |
≤6,47981 |
≤0,15331 |
≤0,19042 |
≤-0,21887 |
≤1,97657 |
≤0,00571 |
≤1,16630 |
|
TafflerR. .Т., Tisshaw Н. |
<0,2 |
≤0,34437 |
≤0,54724 |
≤4,83639 |
≤0,67504 |
≤9,83118 |
≤6,78391 |
≤0,48352 |
≤0,56467 |
|
Springate G. |
<0,862 |
≤1,03398 |
≤ 1,24036 |
≤ 1,03095 |
≤ 1,19964 |
≤1,06522 |
≤1,09941 |
≤1,16605 |
≤1,31559 |
|
Lis. R |
< 0,037 |
≤0,03499 |
≤0,07097 |
≤0,00343 |
≤0,0484 |
≤0,00149 |
≤0,01502 |
≤0,0695 |
≤0,02621 |
|
СайфулинР. С., Кадыков Г. |
<1 |
≤-0,16499 |
≤0,5659 |
≤0,1299 |
≤0,52184 |
≤-0,14699 |
≤-7,61240 |
≤0,47582 |
≤0,72510 |
|
Chesser D. |
≥0,5 |
>0,05408 |
>0,03879 |
>0,06967 |
>0,04215 |
>0,13779 |
>0,00092 |
>0,00463 |
>0,75 |
|
Brinde SCU- Olariu D. |
≥0,5 |
>0,73127 |
>0,84858 |
>0,9999 |
>0,75534 |
>0,61164 |
>0,52036 |
>0,88857 |
>0,59634 |
|
Zmijewski М.Е. |
>0 |
>0,06109 |
>0,47175 |
>1,42149 |
>1,35579 |
>0,85425 |
>1,2636 |
>1,04318 |
>1,30393 |
|
Sorins R., VoronovaI. |
<0 |
≤-0,69983 |
≤-0,34777 |
≤430897 |
≤-2,23809 |
≤-0,8809 |
≤-1,59827 |
≤-0,90125 |
≤-1,64359 |
|
GalvaoR. К. H., Becerra V. М., Abou-Seada М. |
< 0,7548 |
≤0,45293 |
≤0,30151 |
≤ 0,2423 |
≤ 0,08854 |
≤-0,0584 |
≤0,15091 |
≤0,1779 |
≤0,13328 |
Table 4
Bankruptcy prediction accuracy with the application of the proposed ratios
The considered model is best adapted for use in manufacturing and construction industries, while the lowest predictive capability is shown in the industry trade. Such results can be partly explained by the fact that many of the indicators in the model are associated with the assets of the company (including material), composition and structure of which differs significantly in trade and industry. This fact again shows the usefulness of updating of bankruptcy forecasting models considering the industry in which the company operates.
We compared the results of determining the probability of bankruptcy using the proposed and the classical prediction models. It turned out that the financial ratios included in the new model are as neutral as possible regarding industry specificities of companies. This conclusion is based on significant alignment of indexes of overall predictive capability to forecast accuracy for bankrupt companies and financially sustainable companies by sectors. For construction and transport industries, the value of reliability of the forecast, according to our method, exceed the values resulting from the application of any of the considered prediction models. This fact once again confirms the maximum adaptation of proposed model for application in the construction and transport industry.
Any model of bankruptcy forecasting needs to take into account the industry affiliation of reviewed company to improve the prediction accuracy and validity of the results. The use of the found sectoral values of the considered models will allow to increase efficiency of bankruptcy forecasting in practice that will have a positive impact on overall statistics on bankruptcy of legal entities in the national economy, as well as with regard to industry. The developed model demonstrates high predictive capability for companies of all considered industries, after verification on broader sample and proper elaboration it can be implemented in practice that will significantly improve the accuracy of bankruptcy predicting for companies in various industries.
Table 5
Normative values and predictive capability of the model
|
Industry |
standard value |
Predictive capability, % | ||
|---|---|---|---|---|
|
b |
nb |
o |
||
|
The manufacturing industry |
> -0,64630 |
84,1 |
86,0 |
85,0 |
|
Agriculture |
> -0,47827 |
74,2 |
86,8 |
82,0 |
|
Real estate |
>-0,43117 |
83,1 |
82,0 |
82,5 |
|
Construction |
> -0,53444 |
85,0 |
84,5 |
85,9 |
|
Transport |
> -0,82901 |
89,8 |
78,3 |
84,1 |
|
Hotels and catering |
> -0,89084 |
83,6 |
82,5 |
82,9 |
|
Science |
>-0,53033 |
77,9 |
88,9 |
83,7 |
|
Trade |
> -0,55229 |
75,7 |
84,2 |
80,2 |
|
Notes: b - predictive capability for enterprises-bankrapts, nb - the same for non-bankrupts, о - total. |
||||
1. Ilysheva N. N., Kim N. V. (2007) Mathematical model of definition of standards of financial performance //Finances and Credit. N 31 (271).p. 80–87.
2. Fedorova E. A. Dovzhenko, S. E., Fedorov F. Y. (2016) Model of bankruptcy predicting of Russian enterprises: sectoral specificities // Problems of forecasting. No. 3. P. 32–40.
3. Шеремет А. Д. Методика финансового анализа: учеб. пособие / А. Д. Шеремет, Р. С. Сайфулин. М.: Инфра-М, 2004. 208 с.
4. Altman E. I. (1968) Financial ratios, discriminant analysis and the prediction of corporate bankruptcy // The Journal of Finance.Vol. 4. P. 589–609.
5. Bandyopadhyay A. (2006) Predicting probability of default of Indian corporate bonds: logistic and Z-score model approaches //The Journal of Risk Finance. Vol. 7, N3. P. 255–272.
6. Bauer J., Agarwal V. (2014) Are hazard models superior to traditional bankruptcy prediction approaches?
7. A comprehensive test //Journal of Banking & Finance. Vol. 40. P. 432–442.
8. Brîndescu-Olariu D. (2017) Bankruptcy prediction logit model developed on Romanian paired sample //Theoretical & Applied Economics.Vol. 24, N 1. P. 5–22.
9. Chesser D. L. (1974) Predicting loan noncompliance // The Journal of Commercial Bank Lending. August. P. 28–38.
10. Chiaramonte L., Casu B. (2017) Capital and liquidity ratios and financial distress. Evidence from the European banking industry //The British Accounting Review.Vol. 49, N 2. P. 138–161.
11. Galvão R. K. H., Becerra V. M., Abou-Seada M. (2004) Ratio selection for classification models //Data Mining and Knowledge Discovery. Vol. 8, N 2. P. 151–170.
12. Hung C., Chen J. H. (2009) A selective ensemble based on expected probabilities for bankruptcy prediction // Expert systems with applications. Vol. 36, N 3. P. 5297–5303.
13. Korol T. (2013) Early warning models against bankruptcy risk for Central European and Latin American enterprises //Economic Modelling. Vol. 31. P. 22–30.
14. Li M. Y. L., Miu P. (2010) A hybrid bankruptcy prediction model with dynamic loadings on accounting-ratio-based and market-based information: A binary quantile regression approach //Journal of Empirical Finance. Vol. 17, N 4. P. 818–833.
15. Lieu P. T., Lin C. W., Yu H. F. (2008) Financial early-warning models on cross-holding groups //Industrial Management & Data Systems. Vol. 108, N 8. P. 1060–1080.
16. Lin F., Liang D., Yeh C. C. et al. (2014) Novel feature selection methods to financial distress prediction //Expert Systems with Applications. Vol. 41, N 5. P. 2472–2483.
17. Nam J. H., Jinn T. (2000) Bankruptcy prediction: Evidence from Korean listed companies during the IMF crisis //Journal of International Financial Management & Accounting.Vol. 11, N 3. P. 178–197.
18. Sayari N., Mugan C. S. (2017) Industry specific financial distress modeling //BRQ Business Research Quarterly. Vol. 20, N 1. P. 45–62.
19. Šorins R., Voronova I. (1998) Uzņēmuma maksātnespējas novērtējums //Ekonomiskās problēmas uzņēmējdarbībā. N 3. P. 125–131.
20. Taffler R. J. Empirical models for the monitoring of UK corporations //Journal of Banking & Finance. 1984. Vol. 8, N 2. P. 199–227.
21. Taffler R. J., Tisshaw H. (1977) Going, Going, Gone – Four Factors which Predict // Accountancy.Vol. 3. P. 50–54.
22. Tian S., Yu Y., Guo H. (2015) Variable selection and corporate bankruptcy forecasts //Journal of Banking & Finance. Vol. 52. P. 89–100.
23. Zmijewski M. E. (1984) Methodological issues related to the estimation of financial distress prediction models //Journal of Accounting research. Vol. 22. P. 59–82.
24.
Doctor of Economics, Professor of the Department of Corporate Finance and Corporate Management at the FGOBU VO “Financial University under the Government of the Russian Federation”. Research interests: economic and mathematical methods and models, financial management, bankruptcy forecasting.
Postgraduate student of the Department of Corporate Finance and Corporate Management at the FGOBU VO “Financial University under the Government of the Russian Federation”. Research interests: bankruptcy forecasting, financial control, financial management.
Chief financial analyst of JSC “GlobalTel”. Research interests: financial management, bankruptcy forecasting.
Fedorova E.A., Khrustova L.E., Chekrizov D.V. Industry characteristic of bankruptcy prediction models appliance. Strategic decisions and risk management. 2018;(1):64-71. https://doi.org/10.17747/2078-8886-2018-1-64-71
Ligovsky av 73, of.401, Saint Petersburg, 190040, Russia
Tel.: +7 (812) 346-50-15 (16)
Real Economy Publishing House.
E-mail: info@jsdrm.ru
Registration certificate PI No. FS-77 - 72389 from 02.28.2018, issued by the Federal Service for Supervision in the Sphere of Communications, Information Technologies and Mass Communications.
Processing of personal data


