


Contents
Scroll to:
https://doi.org/10.17747/2618-947X-2022-2-160-170
Scroll to:
Currently, retail is one of the fastest growing segments of the Russian economy with a noticeable real practical implementation and application of digital solutions. The introduction of digital products covering the trading process confidently brings the industry closer to the leading pool of digitalization industries (banks, ICT, insurance, media, industry, etc.), becoming the main tool in attracting consumers and increasing profits.
The article describes the results of an experiment on the introduction of automation for the management of assortment matrices of goods. The positive effect and profit for retail companies are shown. In conclusion, recommendations are offered on the formation of a methodology for various participants in the assortment management process.
Katasonov I.A. DIGITAL TRANSFORMATION OF RETAIL TRADE: ЕFFICIENCY OF AUTOMATION AND ROBOTIZATION OF BUSINESS PROCESSES. Strategic decisions and risk management. 2022;13(2):160-170. https://doi.org/10.17747/2618-947X-2022-2-160-170
The end-to-end penetration of new technologies accompanied by profound changes in the structure and nature of the modern consumer market, increased requirements for the development of trade on a global scale makes inevitable the transformation of the “classical” retail model. The natural potential and flexibility to introduce digital products, combined with a high degree of socialisation of the trading industry, provide expanded opportunities for functioning in a new competitive digital environment and achieving the greatest dynamics of technological advancement relative to other types of economic activity [Digital transformation, 2021].
One tool that helps retailers compete is Efficient Consumer Response (ECR). This tool involves the formation and management of the assortment and individual categories based on the requests and needs of consumers [Winning in a Digital Era, 2021]. A separate assortment control element was created - the assortment matrix. A high-quality assortment matrix, which will bring the greatest income, profit or traffic (depending on the goals), is the main result of the work of a category manager. Its timely updating is the most important task on which the success of its work and the results of the company depend [How to carry out digital transformation.., 2020]. At the same time, assortment management is characterised by low marginality of the sphere and high labor costs [Zvereva, Deputatova, 2019]. These two factors create a fertile ground for automating these business processes, which allows you to save staff costs, increase the effectiveness of the work performed: volume, speed, quality, etc.
The purpose of this article is to show how automated process of forming assortment matrices allows retailers to achieve higher financial results compared to manual assortment management.
The retail industry is constantly changing driven by rapid and unprecedented technological innovation. This change presents both a challenge and an opportunity for retailers to adapt to a trading environment that has been completely transformed by the $2.3 trillion global e-commerce marketplace, as well as an increasing number of qualified shoppers who are always connected and have permanent access to the world's largest virtual supermarkets [Ideal consultant.., 2018].
For retailers and brands, digital analytics and innovation, whether it’s an AI-powered chatbot that fulfills customer queries or a hyper-local store that gets information from the Internet of Things, is critical to increasing sales and profits in today’s on-demand economy.
Since the pandemic, the global retail market has undergone significant changes. First of all, this concerns the growth in the share of e-commerce [Research on the impact of the pandemic.., 2021]. According to Rosstat, the share of online sales was 4.3% and 3.9% in 2021 and 2020, respectively, against 2% in 2019. They grew twofold in 2020, and, as we see, the trend continues. At the same time, the share of online sales of individual Russian retail players has changed even more [Research on the impact of the pandemic.., 2021].
For example, Detsky Mir increased its share of online sales from 8.2% and 11.7% in 2018 and 2019, respectively, to 24% in 2020, online sales grew by 140% in one year (Table 1)1. Other retailers significantly increased this figure. As you can see, the share of online sales in grocery retail is quite low, but it also tends to grow rapidly [Paskova, 2020].
Another important trend that can be traced in Russian and global retail is the desire for omnichannel and general digitalisation, which consists in blurring the lines between the traditional offline consumer experience and digital [4 retail industry challenges.., 2020]. Companies are actively introducing digital tools into the customer journey. This, for example, is stated by the M.Video - Eldorado group, presenting its concept of “One Retail” [Consumer sector .., 2020]. The same can be observed at the grocery retailer VkusVill: their mobile application has a button "I'm in the store" which provides a discount on random products when buying in an offline store, this application also has a barcode scanning function that allows you to read detailed product information in the app, add it to your shopping list or order online.
Sports retail is not far behind: for example, the Sportmaster chain of stores provides an opportunity to scan a QR code on some products and continue your customer journey in the digital space of a mobile application. This network, like M.Video, has a self-pickup function through the application, which is convenient to use not only from home, but also while in physical stores [Smotrova, Narolina, 2020].
Another example of digitalisation is self-service checkouts and so-called kiosks. The first allow you to independently break through and pay for the goods. They can be used, for example, in stores such as Perekrestok, Auchan, VkusVill, Decathlon, etc. The number of stores with such cash desks is constantly increasing. Kiosks make it possible to get acquainted with the assortment of the store on a large digital screen, place an order for self-delivery from the existing stock of the store or order goods from the warehouse to the store or with home delivery. You can use the kiosk in the stores such as M.Video, Sportmaster or Detsky Mir [Digital 2020.., 2020].
Digitalisation does not affect only the area of improving the customer journey. It extends to other components of modern retail companies: marketing, logistics, assortment management, hiring, communications within the company, etc. Retailers are ambitiously aiming to bring modern technologies into almost all their processes, often without analysing the effectiveness of digitalisation of certain business processes [E-commerce worldwide, w.y.].
Retailers face challenges of a very different nature. As a result of radical changes, such as the explosion of mobile and online commerce, retailers have become embroiled in a highly competitive and multi-channel battle for the consumer's wallet and attention.
Changing customer preferences and behaviors are major catalysts for transformation. New consumers accustomed to instant satisfaction of their needs cannot imagine their lives without a smartphone, the window to the world of communication, work and shopping. They use it to pay bills, book hotels, share vacation photos, and buy household appliances [Retail digital transformation.., 2019].
In this regard, the mechanisms for making decisions about purchases have also changed. Targeted marketing and advertising messages are becoming less effective as consumers rely more on social media friends and other influencers such as YouTube stars.
Another challenge for retailers is that shoppers spend more on restaurants and spa than on physical goods.
They are not tied to specific channels and expect the same convenience and support when buying online, in a mobile device, in a store, or using any combination of these three models.
As noted in the Accenture report, "Consumers expect stores to 'automagically' adjust to them in physical, digital and emotional interactions"2.
The new reality in the retail sector is that any solution that customers find convenient for themselves immediately becomes the standard for the industry, and everyone has to implement it [Weber, Schütte, 2019].
Analysing new consumer expectations, market participants come to the conclusion that long-term strategies aimed at increasing profitability and customer loyalty no longer guarantee sustainable success. To remain competitive in a rapidly changing world, retailers must fundamentally rethink customer interaction models and related business processes and find new ways to apply technology.
Transforming customer acquisition processes requires anticipating the wants and needs of consumers, whether they are in the store, at home, or on the go. They should have access to personalised and relevant information and advertising, as well as convenient shopping mechanisms. Such solutions should be based on technologies for analysing data from various channels, collected by means of sensors and beacons.
In this regard, automated formation of assortment matrices for consumers becomes an important tool for maintaining the competitiveness of the retail business.
Conventional assortment planning includes an analysis of revenue and the level of rotation of goods. However, the blockchain technology available in the modern world, big data tools and advanced analytics allow you to analyse a much larger number of metrics, while spending a minimum of effort, just by “clicking a button”.
The development of advanced analytics and assortment management tools is especially important in the modern world due to the following factors [Smartphone ownership, 2018; Analytical assortment optimisation.., 2019]:
Big brands are constantly improving their products and increasing the number of presented articles. At the same time, local brands offer few articles, but the number of such brands is constantly growing. Do not forget about the growth of private labels, which add a significant number of items to the assortment.
The number of articles is growing, but the amount of shelf space is not. Possibilities to increase or redistribute shelf space are limited or non-existent. In addition, many retailers are now developing small store formats, where there is even less space on the shelf.
Despite the increase in the number of articles, the supply chain is becoming more complex. This creates additional importance in the choice of products to be added to or removed from the listing.
While there is an endless shelf in e-commerce, retailers need to manage inventory in order to keep consumers' attention and control storage and logistics costs.
Retailers have a variety of formats and locations in which they operate. Location-related factors, such as location traffic or area socio-demographic characteristics, affect sales results [The key drivers.., 2020]. The same article in different stores can bring markedly different results. Therefore, the assortment should be optimised taking into account the characteristics of the location. This optimisation usually includes two levels. The first determines how much space on the shelf in a particular location a given category receives, the second determines which articles should be on the shelf in this location.
A study by Mckinsey [Analytical assortment optimisation.., 2019] showed that effective assortment management can bring significant financial results.
The expected contribution for various levers of value creation is presented in Table. 2.
Obtaining a financial result in the given planes requires not a superficial understanding of the assortment, but a deep analysis. For example, a strategic listing should not end with a simple search for trending products, and delisting is not just an exclusion from the matrix of slow-moving products. To manage the matrix, it is important to understand not only the turnover, but also the uniqueness of the product, as well as to conduct a deep analysis of customer needs [The key drivers.., 2020].
To make all these decisions, it is necessary to conduct complex analytics. This can be done most effectively using big data and advanced analytics.
What should be the methodology in order to achieve the results described above?
Methodology goals:
Table 1
The share of online sales in the turnover of large retailers in the Russian market (%)
|
Company |
Industry |
2019 |
2020 |
|
«M.Video – Eldorado» |
Electronics |
33 |
60 |
|
DNS |
Electronics |
13 |
26 |
|
«Detsky Mir» |
Children’s goods |
11.7 |
24 |
|
«Vkus Vill» |
Food retailing |
6.8 |
11.5 |
|
X5 Retail group |
Food retailing |
0.25 |
1.01 |
|
«Magnit» |
Food retailing |
— |
0.13* |
|
«Lerua Merlen» |
DIY |
3 |
9 |
* Recovered sales for the year based on December 2020 data.
Table 2
Expected contribution on various levers of value creation
|
Lever |
Content |
Effect |
|
Systematic exclusion of goods from the assortment matrix (delisting) |
Growing margin from an improved set of products |
Margin growth up to 0.5 pct |
|
Strategic addition of products to the assortment matrix (listing) |
Coverage of previously ignored or underrepresented client needs |
Revenue growth by 2-4% |
|
Supply Chain Simplification |
Lower operating costs in the supply chain, branch operations and product development |
Margin growth up to 0.5 pct |
|
Improved purchase conditions |
Improved leverage in negotiations due to a better understanding of the importance of the supplier |
Reducing the purchase cost by 1-3% |
Источник: [Analytical assortment optimization.., 2019].
The methodology consists of seven stages presented in Fig. 1.
Tool logic. The optimiser ranks SKUs with working lifecycles within store premium tiers and within a group (a group is a classifier level that has a seat limit set).
The methodology helps to automatically take into account:
To rank SKUs the tool uses the following formula: CEI × UI.
It contains two coefficients:
CEI is a consolidated economic indicator, which is calculated in terms of premium based on 3 months of sales history, receipts and margin, taking into account the sales recovery operation. Sales recovery is an operation that allows you to calculate the possible sales of an article if it was available only in some stores or in part of the period under review. The operation of normalising the indicators necessary for calculating the CEI is also carried out: goods for each indicator receive values from 0 to 1, from worst to best. This is necessary in order to take into account different dimensions in the summary indicator (sales can be ten times more than the margin and thousands of times more than units). When calculating the CEI, the weights of various metrics can be changed in accordance with the goals.
UI (Uniqueness index) = (Product similarity to itself = 100%) / (Sum of similarities to all products within the same need identified in the previous step).
The tool calculates metrics to rank products according to store grouping by premium. That is, the final matrix in more premium stores will differ from the matrices in lower premium stores. This allows you to increase the efficiency of the final matrix.
Based on the constructed tree of client needs, it is possible to draw conclusions applicable in related processes: determining categorisation, filters on the site, merchandising, etc.
For example, we observe that a group of products has formed in the tree under the “teapots” category, where all products have a retro design:
This tool allows you to reduce the amount of manual labor, expand the possible amount of assortment covered by one category manager, increase the quality of analysis by increasing the number of analysed indicators and calculations that a category manager can carry out. In the modern retail market, where marketplaces with their very large assortment are actively expanding, profile retailers need to expand their assortment in order to remain competitive. This tool allows you to manage this expanding range effectively.
Additional ways to use blockchain technology in assortment management:
Fig. 1. Methodology for calculating assortment matrices
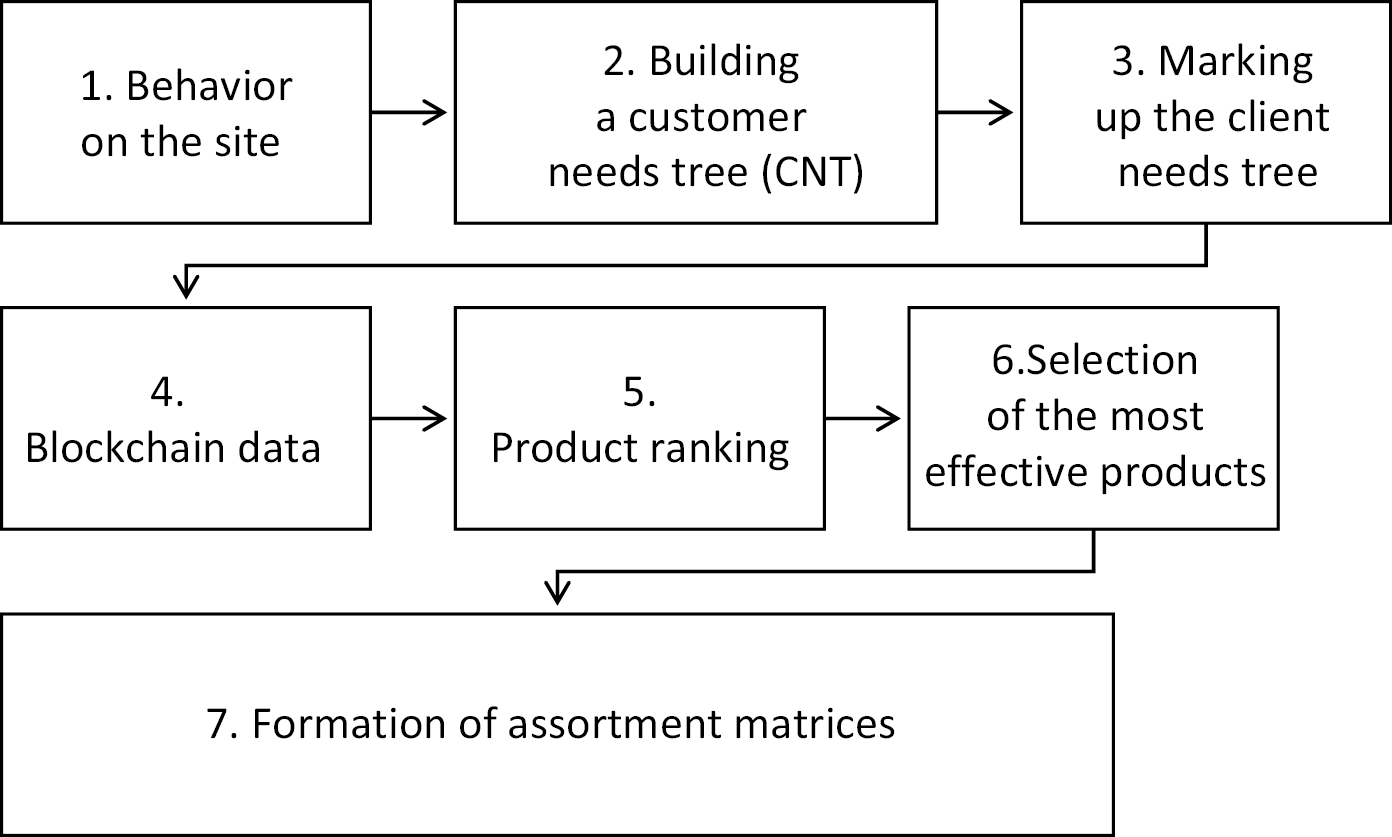
Source: compiled by the author.
Fig. 2. Customer Needs Tree (CNT)
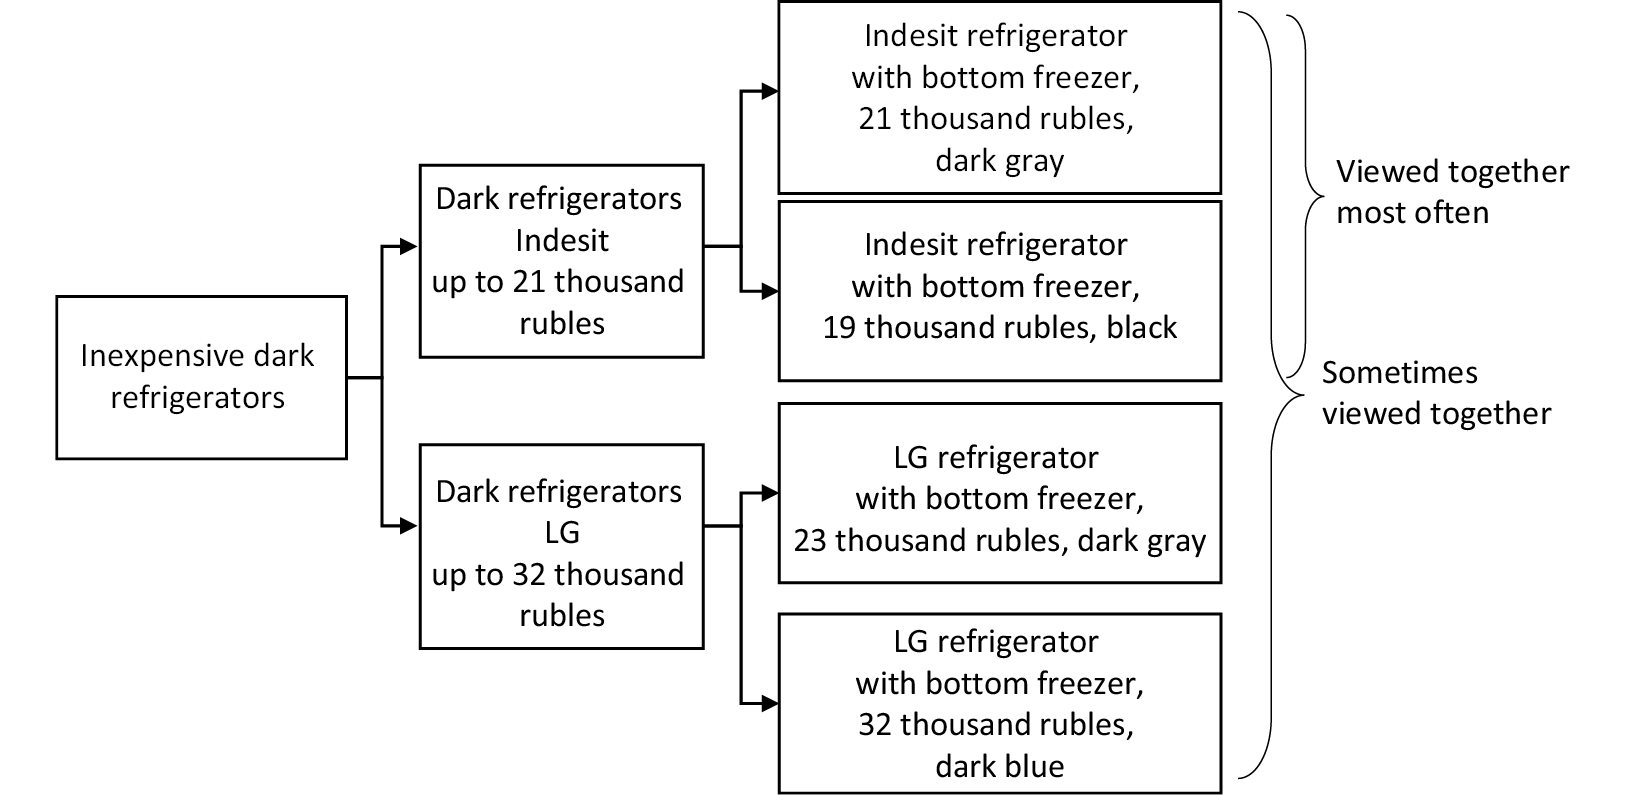
Source: compiled by the author.
Pilots are conducted to evaluate the results of the methodology. Their goal is to obtain confirmation of the optimised matrix effectiveness in certain categories and to refine the values of the target product metrics depending on the calculated effect.
Pilot metrics - growth in sales, margins, checks in the stores of the pilot group (with pilot matrices) relative to the stores of the control group (matrices do not change). The stages of the pilot are shown in Fig. 3.
Fig. 3. Stages of conducting pilots
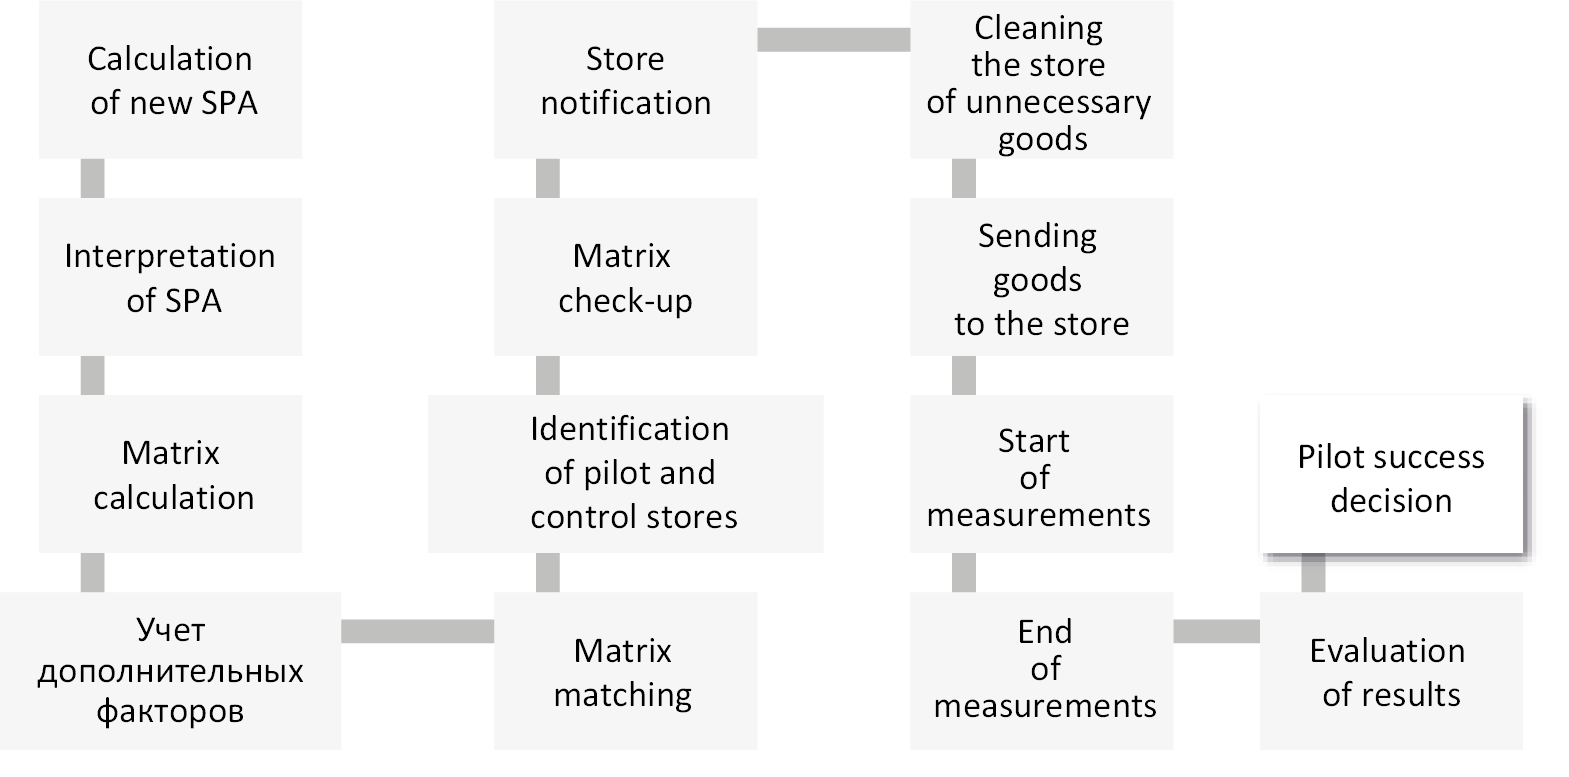
Source: compiled by the author.
The effect will be evaluated using A/B testing.
Description of the experiment
Using the data analysis methodology, an assortment matrix for stores is formed, that is, which goods should be sold in which stores. Then a subgroup of pilot stores is determined, where the goods are sent in accordance with the compiled matrix, as well as a subgroup of control stores, where the matrix remains unchanged. Next, the sales results of these two subgroups are compared in the context of the selected target metric, for example, sales in rubles. At the end, it is concluded how good the assortment matrix that was formed is.
Subtasks of A/B testing
Subtasks that need to be solved in order to conduct A/B testing correctly:
Each of these items is described below.
Observation Period Estimation
The number of observations is the product of the group size (A/B) and the length of the time interval during which the pilot is conducted. The time section can be different (depending on the characteristics of the target metrics): hour, day, week, month, etc. For example, if the minimum number of observations is 100,000, then you can pilot on 10,000 clients for 10 days (if the metric is daily) or on 5,000 clients for 20 days. You can go from the opposite. Depending on the volume of clientele and the time that the company is willing to spend on the pilot, you can calculate what minimum effect can be caught at a certain level of significance (usually they talk about 95% significance level) and dependence on the values of errors 1 and 2 -cities.
Formation of the pilot and control group
After the formation of the pilot design (duration of the pilot + group size), the formation of the control and pilot groups begins. If we talk about customers, then in the case of a large audience, it is better to make a random stratified sample of the desired size. As stratification parameters, you can use such as city, salary level, marital status, field of activity, age, gender, etc. Similarly, a control group is generated from the remaining clients in the same stratified and random way. At this stage, you should check if there is an effect on the target metrics in the pre-pilot period, thereby making sure that the formed groups are identical in their behavior before the start of the pilot.
In the case of offline stores, there is no way to select groups in the same way as online experiments. It is necessary to come up with other ways to select a control group. In order to assess honestly the pilot changes, it is necessary to find a control group that would be as similar as possible to the experimental one during the pilot period.
As soon as the groups are formed and the identity of the groups on the pre-pilot is visible in the context of the target metrics of interest, you can start running the pilot and introduce the desired changes on the clients of the target group. After the required amount of time, the effect is evaluated. The effect estimate is a point estimate coupled with a confidence interval that covers the true effect value with a certain probability (usually 95%).
It should be noted that it is desirable to estimate the errors of the 1st and 2nd kind of the group selection algorithm. For this, groups are formed on the pre-pilot (pseudo-pre-pilot) and the effect is evaluated on the pre-pilot (pseudo-pilot). In our paradigm, there should be no effect on the pre-pilot, since there was no effect.
Type 1 error is a situation where an effect was identified, but in fact it does not exist.
Type 2 error is a situation where the effect could not be identified, but it actually exists.
In order to achieve an increase in the accuracy of estimates and narrowing of confidence intervals, different approaches are used related to the transformation of the initial data in such a way that the point estimates do not change, but their accuracy increases.
When the pilot is over, the effect and confidence interval are calculated.
Working with a retailer with offline stores is significantly different from the usual online A / B tests. As a rule, the technique is associated with online metrics: how affected conversion changes, return rate, CTR, etc. Most of the experiments are related to interface changes: the banner was rearranged, the button was recolored, the text was replaced.
In live stores of classic retailers, changes are much more complicated than changes in the site interface. This imposes restrictions on the metrics. Basically, margin and revenue are considered. Both margin and revenue are volatile metrics; they are measured in thousands, hence the standard deviation is measured in thousands.
The formula for calculating the number of store days says that the larger the variance, the more data is needed for any meaningful conclusions. To catch the effect even in tenths of a percent with such a large variance in revenue, pilots need to spend six months in stores.
Of course, no one will agree to conduct a pilot for six months. Therefore, we decided to move to the revenue or margin of the product category, rather than the entire store. The variance of this metric is expected to be much lower than that of the entire store metric. This allows you to measure a smaller effect.
In the course of the work, a list of tasks was developed that must be consistently solved for successful assortment management experiments in retail stores (Table 3).
Table 3
Stages of the experiment on assortment management in retail stores
|
Pilot stage |
Stage content |
|
Calculation/updating of the customer needs tree |
Calculation of a new customer needs tree Interpretation (pegging) |
|
Forming new assortment matrices |
Calculation of assortment matrices Consideration of additional factors (for example, goods that cannot be excluded from the matrix) Accounting for premium stores and needs |
|
Preparing points for the pilot |
Selection of pilot and control stores Cleaning stores from old goods through sales and export Delivery of missing goods |
|
Holding a pilot |
Selling new assortment in pilot stores Operational control holding pilot Regular monitoring of the effect |
|
Evaluation of results |
Evaluation the pilot results Making a decision about the success of the pilots |
Source: compiled by the author.
The experiment was conducted in retail stores. 5 product categories participated in the pilot:
1) category of small household appliances (hereinafter referred to as SHA) 1;
2) category of large household appliances (hereinafter referred to as LHA) 2;
3) LHA category 3;
4) LHA category 3 and SHA category 4;
5) accessories category 5.
For each of the presented categories, pilot stores were identified based on the principle of maximum availability of goods from new matrices in them. For each pilot store, a control store was selected based on the principle of sales similarity. With the directors of the stores, in which the piloting of the categories of large-sized equipment was carried out, an agreement was passed on the import of new matrix goods.
As a result of applying the developed methodology, matrices were obtained for pilot store-category pairs. The analysis of these matrices for their discrepancy gave the following results:
MM = (P ⋂ C) / (C),
where CM is the matrix match, P is the matrix of the pilot store, K is the matrix of the corresponding control store, P ⋂ C is the number of intersecting articles in the pilot and control matrix.
|
Category |
MM |
|
SHA Category 1 |
36%; |
|
LHA Category 2 |
48%; |
|
LHA Category 3 |
56%; |
|
LHA and SHA Category 4 |
61%; |
|
Accessories category 5 |
82%. |
As you can see, the matrices of control and pilot stores coincide from 36 to 82% depending on the category. This indicates a significant difference between the matrices.
Table 4 shows how the methodology changed the matrices in relation to the pre-pilot matrices of the same store.
Table 4
Change of assortment matrices in relation to pre-pilot ones (%)
|
Category |
Share of new articles |
Share of withdrawn articles |
|
SHA category 1 |
34 |
70 |
|
LHA category 2 |
50 |
54 |
|
LHA category 3 |
52 |
43 |
|
LHA and SHA category 4 |
24 |
37 |
|
Accessories category 5 |
34 |
16 |
Source: compiled by the author.
The shares are calculated according to the following formulas:
Share of new articles = (Number of new articles) / (number of articles in the pre-pilot matrix);
Share of withdrawn articles = (Number of withdrawn articles) / (number of articles in the pre-pilot matrix).
As you can see, the matrices have changed significantly since the beginning of the pilot, the spread of changes varies significantly depending on the categories. Thus, the share of new articles in various categories is in the range from 24 to 50%, the share of withdrawn articles - in the range from 16 to 70%.
It should be noted that before receiving the final matrix, the category manager looks at the optimizer's proposals and makes his own changes to the matrices. During the pilot process, the share of acceptance by category managers of the optimizer's proposals was at the level of about 70%, depending on the product group, this indicator could differ by +/- 10 pct
The analysis suggests that our tool does indeed perform significant actions on the assortment matrix. Now we need to check what are the results of these changes.
As a result of the experiment, two components can be distinguished:
Dashboards were developed in the Power BI program to conduct a rapid assessment. Thanks to these dashboards, the team could constantly monitor the dynamics of indicators important for the pilot and make operational decisions necessary for the successful conduct of the pilots. For example, it was possible to see the availability of items added to the matrix and the average availability of the matrix items in the pilot and control stores, and based on this make decisions in order to increase these indicators in the pilot stores to a level comparable to the control stores.
Dashboards also show serious deviations in product revenue, if any exist. Small deviations on them are difficult to notice, but large ones became signals for the need for further analysis.
Despite the impossibility of drawing accurate conclusions about the success of the pilots based on dashboards, they were very useful in the process of operational management of experiments.
Table 5 shows an assessment of the effects after the introduction of pilot experiments on the management of the assortment matrix.
As a result of the pilots, confirmed effects were obtained from new matrices in two categories out of five. In two categories, the effect was not confirmed. It can be assumed that the lack of effect in the two categories is associated with a significant gap in the availability of “new recommended” and “old” products.
Thus, we can conclude that the introduction of automation works and brings noticeable results. As part of the pilot implementation of the project, the result obtained translates into billions of rubles in revenue and EBITDA growth per year. It is important to note that this effect will be especially noticeable for large retailers with multi-billion dollar annual turnover; for small and medium-sized companies it is necessary to conduct an additional assessment of the costs and benefits of implementing such a methodology.
Table 5
Evaluation of the results of pilot projects on assortment matrix management
|
Category |
Effect* |
|
SHA category 1 |
Confirmed, + 2% to revenue |
|
LHA category 2 |
Is not confirmed |
|
LHA category 3 |
Confirmed, + 0.5% to revenue, + 5% to margin |
|
LHA and SHA category 4 |
Is not confirmed |
|
Accessories category 5 |
Confirmed, + 3% to revenue |
* Confidence interval 95%.
Source: compiled by the author.
Assortment management in the field of safety and security has a number of features that must be taken into account when developing a methodology and conducting pilots.
Deficiencies. One of the key features is the presence of deficits. Some goods can be successfully delivered by the described tool to the matrix, but due to the fact that this product is in short supply, it simply will not get on the shelf, since there are not enough of it even in warehouses. Deficiencies are important to consider when conducting a pilot and operating an instrument.
Product Leadtime. The time it takes to ship an item from a warehouse to a store varies greatly by category and region. If phones are often sent by plane and they arrive in the first week after they hit the matrix, then household appliances can go for three weeks, a month or more. This is important to consider when evaluating the effect of pilots. It is possible that the product that was added to the matrix did not stay in the store for the entire duration of the pilot. This error in the pilot's assessment has a high risk of erroneous conclusions. Leadtime can be influenced by the choice for the pilot of stores that have minimal logistical "shoulders".
The two previous points are related to accessibility but are not exhaustive. When conducting pilots, it is worth regularly analysing the availability of goods in piloted categories and identifying anomalies with further clarification of their causes. Accessibility is one of the main factors influencing the success of pilots, so it should always be taken into account.
Store overload. Stores are overloaded to varying degrees, some of the goods may be delivered much more than provided. It is better not to carry out pilots in such stores, since the goods that will be sent may not get on the shelf or get there, but they are not in the conditions that the tool suggests. To reduce store overload, you can use sales and withdrawal of goods from the store during the pre-pilot period.
Brand zones. Many retailers have brand zones, and products from them cannot be removed from the store. Therefore, when conducting a pilot, it is better to avoid stores with a large number of brand zones in their assortment - they can create additional noise.
For companies in other retail industries
When managing the assortment, it is worth looking at the assortment through the prism of customer needs, formed on the basis of the analysis of customer behavior, and not only through the classical categorisation, which is built on the perception of customer needs based on the expert assessment of the category manager or the opinions of suppliers. One of the best ways to understand needs is to collect and analyse customer behavior data. Thus, one can see features that may differ from the usual picture of categorical previous control.
When conducting pilots and implementing an assortment management methodology, it is important to take into account the specifics of the industry: the shortage of goods, the peculiarities of working with suppliers, the expiration date of the goods (if appropriate), the specifics of logistics, etc.
It is important to evaluate the potential benefits from the introduction of a new tool: are they sufficient to recoup the risks and costs of development and implementation. Perhaps the scale of the company or the peculiarities of the work will not allow you to recoup the investments and risks.
For category managers
It is very important that the tests and implementation of the tool are successful. Here, much may depend on the assistance of category managers. They can speed up or slow down testing and implementation. To get the maximum result from the implementation, it is worth taking an active position in the process of developing, testing and implementing the product. A quality product will free up a significant amount of time and labor resources from tasks that will be automated. The category manager will be able to direct the released resources to solving more creative tasks (working with a supplier, searching for new assortment niches, etc.).
For methodology developers
When developing a methodology, it is extremely important to take into account the peculiarities of the retail business and refine the methodology depending on it. The tool should be built into a user-friendly product with a clear and comfortable interface. The faster category managers get used to the product, the more effective the implementation will be. It is worth taking into account the opinion and experience of category managers when developing a methodology, conducting pilots - their comments can be useful for developing and further implementing the tool.
Also, to further improve the tool, you can add the following functions to it:
1 Annual reports of PJSC Detsky Mir. https://ir.detmir.ru/blog/yearly-reports/..
2 Channel shift: Prioritizing digital commerce (2020). https://www.accenture.com/us-en/about/company/coronavirus-digital-commerce-impact
1. Zvereva A.O., Deputatova E.Yu. (2019). Transformation of trade services in the digital economy. Трансформация торговых услуг в цифровой экономике. Bulletin of the REA named after G.V. Plekhanov, 4(106). https:// cyberleninka.ru/article/n/transformatsiya-torgovyh-uslug-v-tsifrovoy-ekonomike. (In Russ.)
2. An ideal consultant: How chat bots help develop business (2018). Forbes, December 18. https://www.forbes.ru/tehnologii/369829-idealnyy-konsultant-kak-chat-boty-pomogayut-razvivat-biznes. (In Russ.)
3. Study of the impact of the COVID-19 pandemic on Russian business (2021). RBC. Market Research. https://sapmybiz.rbc.ru/RBKIssledovanievliyaniyapande miiCOVID19narossiyskiybiznes.pdf. (In Russ.)
4. How to carry out digital transformation and why (2020). Industry 4.0, September 30. https://trends.rbc.ru/trends/industry/5ec2bcda9a7947a41681dee2. (In Russ.)
5. Paskova A.A. (2020). Integration of artificial intelligence technologies and the industrial Internet of things. Issues of Sustainable Development of Society, 4(2): 607-612. (In Russ.)
6. The consumer sector in Russia (2020). Deloitte. https://www2.deloitte.com/content/dam/Deloitte/ru/Documents/consumer-business/russian/CBT-2020-RU-NEW.pdf. (In Russ.)
7. Smotrova T.I., Narolina T.S. (2020). Digitalization trends in retail trade. Econominfo, 1. https://cyberleninka.ru/article/n/tendentsii- tsifrovizatsii-v-roznichnoy-torgovle. (In Russ.)
8. Analytical assortment optimization Maximizing assortment profitability at the push of a button (2019). Retail аnalytics. McKinsey &
9. Company. October. https://www.mckinsey.com/~/media/mckinsey/industries/retail/how%20we%20help%20clients/big%20data%20and%20advanced%20analytics/mck_retail_analytics_brochure_v10.pdf.
10. Digital 2020: Global review of digital technologies (2020). DataReporta. https://datareportal.com/reports/digital-2020-global-digital-overview. (In Russ.)
11. Digital transformation in the retail industry: empowering it to deliver strategic value to business (2021). Inter Systems. https://www.intersystems.com/bnl-nl/wp-content/uploads/ sites/8/InterSystemsDP-for-Retail.pdf.
12. E-commerce worldwide (б.г.). Statista. https://www.statista.com/ study/10653/e-commerce-worldwide-statista-dossier/.
13. Retail digital transformation challenges. What went wrong with big box retailers? (2019). Infovision, March 15. https://www.infovision.com/retail-digital-transformation-challenges/.
14. Smartphone ownership on the rise in emerging economies (2018). Pew Research Center. https://www.pewresearch.org/global/2018/06/19/2-smartphone-ownership-on-the-rise- in-emerging-economies/.
15. The key drivers of digital transformation in retail (2020). Information Age, April 10. https://www.information-age.com/key-drivers-digital-transformation-retail-123488893/.
16. Weber F., Schütte R. (2019). A domain-oriented analysis of the impact of machine learning – the case of retailing. Big Data and Cognitive Computing, 3(1): 11.
17. Winning in a Digital Era (2021). McKinsey&Company. https://www. mckinsey.com/industries/retail/our-insights/future-of-retail-operations-winning-in-a-digital-era#.
18. 4 retail industry challenges that predictive analytics can solve quantzig (2020). https://www.quantzig.com/blog/retail-industry-predictive -analytics.
Project manager, “Capt” JSC (Moscow, Russia). Research interests: introduction of new technologies, digital transformation of retail, introduction of blockchain technologies in the activities of retail companies.
Katasonov I.A. DIGITAL TRANSFORMATION OF RETAIL TRADE: ЕFFICIENCY OF AUTOMATION AND ROBOTIZATION OF BUSINESS PROCESSES. Strategic decisions and risk management. 2022;13(2):160-170. https://doi.org/10.17747/2618-947X-2022-2-160-170
Ligovsky av 73, of.401, Saint Petersburg, 190040, Russia
Tel.: +7 (812) 346-50-15 (16)
Real Economy Publishing House.
E-mail: info@jsdrm.ru
Registration certificate PI No. FS-77 - 72389 from 02.28.2018, issued by the Federal Service for Supervision in the Sphere of Communications, Information Technologies and Mass Communications.
Processing of personal data


